


BNB Price Today: BNB/USDT 4H Chart Analysis and Key Levels
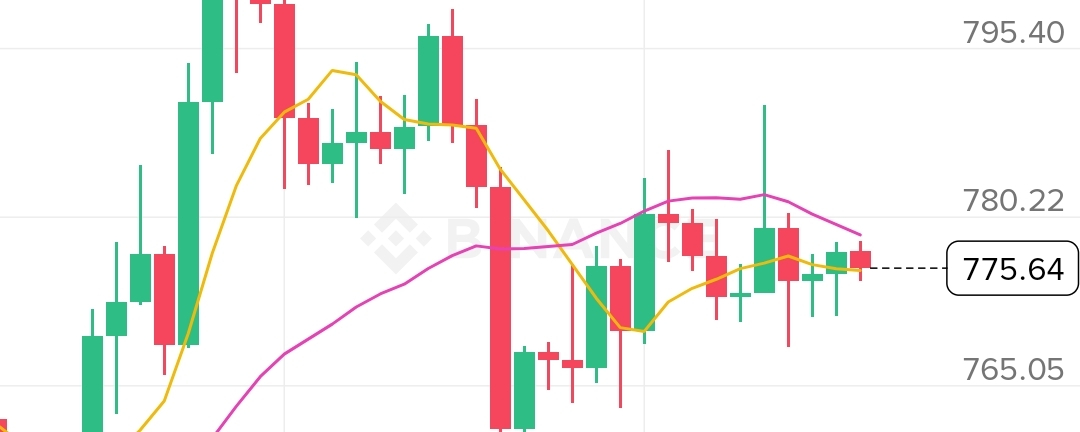
BNB is trading around the $775 level today, according to the Binance chart shared for this analysis. The 4-hour chart shows that BNB has recently moved strongly from the $745–$746 area toward the $807 region and is now consolidating.
At the time of the screenshot, BNB was around $775.64, with a 24-hour high of $790.29 and a 24-hour low of $768.58.
📊 Current BNB Technical Picture
The short-term moving averages are close to the current price:
MA(7): $775.44
MA(25): $778.63
MA(99): $747.18
BNB is currently near its 7-period moving average but slightly below the 25-period moving average. This indicates that the short-term market is relatively balanced, with buyers and sellers competing around the current zone.
The longer-term 99-period moving average shown on the chart is around $747, considerably below the current price.
🔼 Important Resistance Levels
The first area to watch is $778–$780.
If BNB moves above this zone and maintains momentum, traders may watch:
$790 → $807
The $790 level is particularly important because it is close to the displayed 24-hour high. The previous chart high near $807.49 is another major level visible on the 4-hour chart.
🔽 Important Support Levels
On the downside, the first support area is around:
$768–$765
If selling pressure increases and BNB breaks below this area, the next zones visible on the chart are around $750–$745.
The recent low near $745.90 and the MA(99) near $747.18 make this region technically significant on the provided chart.
📈 What Traders May Watch Today
The main question for BNB is whether price can move decisively above the $780–$790 zone or whether it remains inside the current range.
A sustained move above resistance could put higher levels such as $807 into focus. On the other hand, a break below $765 could bring the lower support zones into attention.
These are technical scenarios, not guaranteed predictions. Cryptocurrency prices can change rapidly, so traders should consider volatility and their own risk before making any decision.
Conclusion
BNB is currently showing a consolidation pattern around $775 after its recent move from the mid-$740s toward $800+. The $780–$790 resistance zone and $765 support are the key areas to watch from the chart provided.
BNB/USDT remains a market to watch closely today. 📊
#BNB #BNBUSDT #Binance #Crypto #CryptoMarket #BNBPrice #Trading #Web3 #Bitcoin #Altcoins