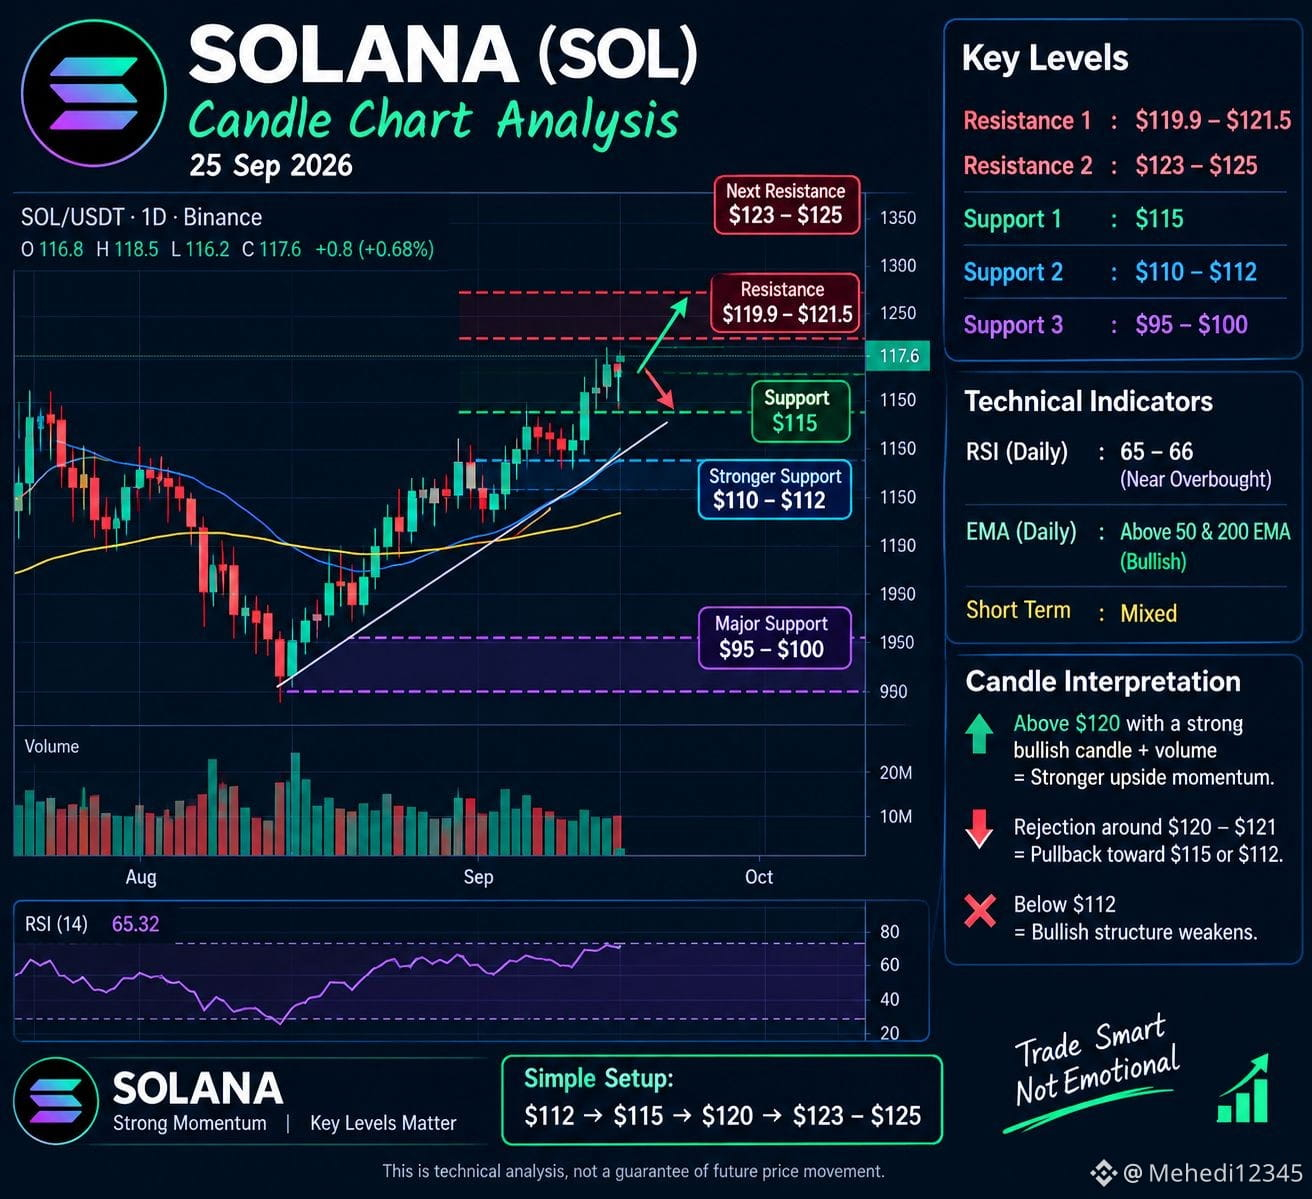
$SOL ## Solana (SOL) Candle Chart Analysis — 25 Sep 2026
SOL is trading around **$117–$118**. Recent price action shows a recovery from the August lows and a sequence of higher lows, but the price is now approaching an important resistance area. ([CoinMarketCap][1])
Solana
### 📊 Key levels
* **Resistance:** $119.9–$121.5
* **Next resistance:** around $123–$125
* **Support:** $115
* **Stronger support:** $110–$112
* **Major lower support:** around $95–$100 ([CoinMarketCap][1])
### 🕯️ Candle interpretation
* **Above $120 with a strong bullish candle + volume:** would indicate stronger upside momentum.
* **Rejection around $120–$121:** could produce a pullback toward $115 or $112.
* **Below $112:** the current short-term bullish structure would weaken.
* Daily RSI is around **65–66**, showing strong momentum but approaching an overbought area. ([CoinLore][2])
* The daily chart remains above the 50- and 200-period EMA, while some shorter-term indicators are mixed. ([CoinLore][2])
**Simple setup:**
`$112 support → $115 → $120 resistance → $123–125`
[1]: https://coinmarketcap.com/cmc-ai/solana/price-analysis/?utm_source=chatgpt.com "Latest Solana (SOL) Price Analysis"
[2]: https://www.coinlore.com/coin/solana/technical-analysis?utm_source=chatgpt.com "Solana (SOL) Technical analysis | CoinLore"
#sol板块 #SOL空投
SOL is trading around **$117–$118**. Recent price action shows a recovery from the August lows and a sequence of higher lows, but the price is now approaching an important resistance area. ([CoinMarketCap][1])
Solana
### 📊 Key levels
* **Resistance:** $119.9–$121.5
* **Next resistance:** around $123–$125
* **Support:** $115
* **Stronger support:** $110–$112
* **Major lower support:** around $95–$100 ([CoinMarketCap][1])
### 🕯️ Candle interpretation
* **Above $120 with a strong bullish candle + volume:** would indicate stronger upside momentum.
* **Rejection around $120–$121:** could produce a pullback toward $115 or $112.
* **Below $112:** the current short-term bullish structure would weaken.
* Daily RSI is around **65–66**, showing strong momentum but approaching an overbought area. ([CoinLore][2])
* The daily chart remains above the 50- and 200-period EMA, while some shorter-term indicators are mixed. ([CoinLore][2])
**Simple setup:**
`$112 support → $115 → $120 resistance → $123–125`
[1]: https://coinmarketcap.com/cmc-ai/solana/price-analysis/?utm_source=chatgpt.com "Latest Solana (SOL) Price Analysis"
[2]: https://www.coinlore.com/coin/solana/technical-analysis?utm_source=chatgpt.com "Solana (SOL) Technical analysis | CoinLore"
#sol板块 #SOL空投