BTC/USDT Technical Analysis
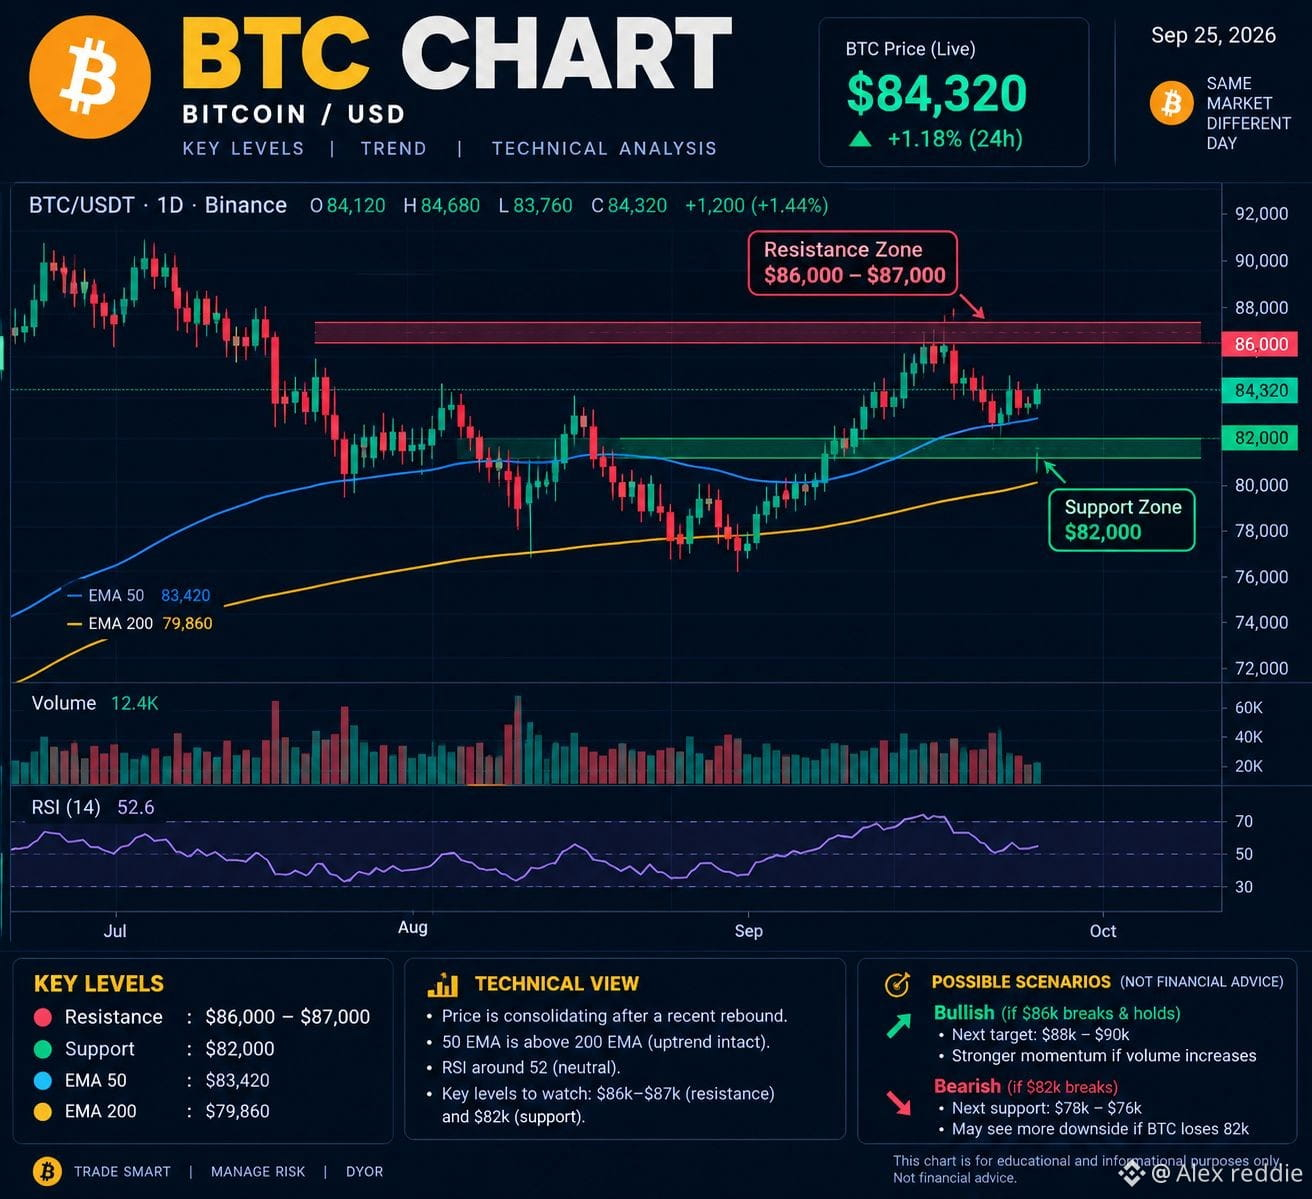
Current price: $84,320
Trend: Short-term bullish/neutral consolidation.
Resistance: $86,000–$87,000
Support: $82,000
EMA 50: $83,420
EMA 200: $79,860
RSI: 52.6 — neutral.
Bullish scenario: A strong daily close above $87,000 could open the way toward $88,000–$90,000.
$BTC
Bearish scenario: If BTC loses $82,000, downside could extend toward $78,000–$76,000.
Key point: BTC is currently above the 50 EMA and well above the 200 EMA, but the $86K–$87K resistance zone is the key level to watch. Volume confirmation would make a breakout more meaningful.
Educational analysis only, not financial advice.
Current price: $84,320
Trend: Short-term bullish/neutral consolidation.
Resistance: $86,000–$87,000
Support: $82,000
EMA 50: $83,420
EMA 200: $79,860
RSI: 52.6 — neutral.
Bullish scenario: A strong daily close above $87,000 could open the way toward $88,000–$90,000.
$BTC
Bearish scenario: If BTC loses $82,000, downside could extend toward $78,000–$76,000.
Key point: BTC is currently above the 50 EMA and well above the 200 EMA, but the $86K–$87K resistance zone is the key level to watch. Volume confirmation would make a breakout more meaningful.
Educational analysis only, not financial advice.