

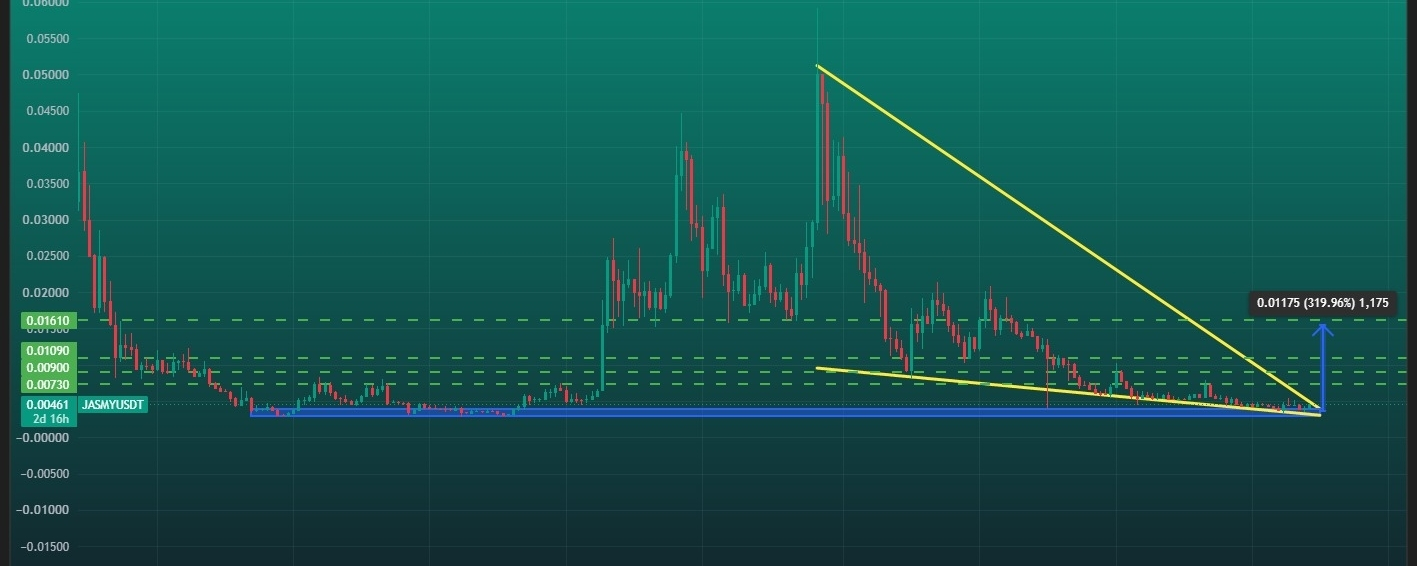

$JASMY (JasmyCoin/USDT) has squeezed right into the apex of a massive multi-year pattern on the 1W timeframe! Price is sitting right at absolute macro support, setting up an exceptional risk-to-reward opportunity.
Whether you read this structure as a Falling Wedge or a Descending Triangle bouncing off the $0.0038–$0.0042 horizontal demand zone, the trigger remains identical: a weekly close breaking above diagonal resistance opens the doors for a massive rally! 🎯
💵 Coin: JASMY / USDT
⌛ Time Frame: 1W (Weekly)
🏦 Exchange: Binance
📍 Current Price: around $0.00450
📉 Pattern: Falling Wedge / Descending Triangle Dual Compression
🎯 Current Area: around $0.00447
📉 Immediate Resistance / Breakout Level: $0.00500 – $0.00550
🎯 Key Resistance: $0.00730 → $0.00900 → $0.01090 → $0.01610 (Measured Target) → $0.01900
🛡️ Key Support Zone: $0.00390 – $0.00290
📐 Pattern & Technical Structure
🔻 Upper Descending Resistance Line
Extends from the major cycle high near ~$0.0500 (late 2024 / early 2025) down to current price levels. This acts as the macro trend boundary preventing upside expansion.
🔺 Lower Converging Support Lines
Yellow Slanted Support: Forms the lower boundary of a Falling Wedge, showing higher support absorption toward the apex.
Blue Horizontal Support: Forms the base of a Descending Triangle around the $0.00390 – $0.00290 region.
🔄 Macro Compression Phase
Price has compressed tightly into the final apex of both overlapping patterns on the weekly timeframe. Volatility has reached historic lows, signaling a major volatility expansion.
⚡ Breakout Target Projection
The chart features a measured price target tool projecting a move toward $0.01610 (+319.96% potential upside) upon a validated macro breakout.
🟢 Bullish Scenario
🚀 A decisive weekly candle close above the descending trendline (~$0.00500 – $0.00550) confirms a breakout out of the multi-month compression structure.
📈 Follow-through buying volume could initiate a multi-leg recovery rally toward historical horizontal levels:
🎯 Target 1: $0.00730 (Initial horizontal resistance / +63%)
🎯 Target 2: $0.00900 (Intermediate structural target)
🎯 Target 3: $0.01090 (Major horizontal supply zone)
🚀 Target 4 (Chart Projection): $0.01610 (+319.96% measured move from the wedge base)
🚀 Major Target: $0.01900 (High-timeframe structural swing high)
🔴 Bearish Scenario
⚠️ If JASMY fails to break overhead resistance and gets rejected, price could continue moving lower inside the compression structure.
📉 A breakdown below the horizontal support zone would invalidate the potential accumulation structure and open up lower price discovery.
🎯 Key Support Levels:
🛡️ $0.00390: Upper boundary of the major support zone
🛡️ $0.00290: Macro low / lower boundary of the support zone
❌ Bullish Invalidation: A weekly candle close below $0.00290.
Under these conditions, buyers should be cautious of the possibility that price could resume its long-term bearish trend.
🎯 Conclusion
📊 JASMY/USDT is trading in a crucial decision area on the 1W chart, compressing tightly between dynamic trendline resistance and macro support.
🟢 Bullish: Confirmed weekly candle close above $0.00550 → Opens path toward $0.00730, $0.01090, and the measured target at $0.01610 (+319.96%).
🔴 Bearish: Breakdown and weekly close below $0.00290 → Invalidates the bullish setup and extends the long-term downtrend.
⚠️ Macro 1W breakouts carry strong reliability; always wait for weekly candle closing confirmation to avoid wicks or false breakouts.
📐 Pattern Explanation — Descending Triangle & Falling Wedge
The chart features a rare multi-pattern overlay where price action compresses between two overlapping structural models near a long-term bottom:
🔻 1. Descending Triangle Structure
Dynamic Resistance: Lower highs forming a steep downward trendline extending from $0.0500+.
Horizontal Support Base: Flat buyer defense zone held firmly at $0.0039 – $0.0029.
Market Psychology: Sellers consistently push lower peaks, but buyers repeatedly hold the floor, creating maximum price compression near the apex before a violent breakout or breakdown.
🔺 2. Falling Wedge Reversal Structure
Upper & Lower Slanted Boundaries: Both resistance and support lines slope downward and converge toward a tightening point.
Market Psychology: Indicates seller exhaustion as downside momentum slows down. Historically, a falling wedge acts as a powerful bullish reversal pattern when price breaks out above the upper trendline.
⚡ Why This Zone Matters
As price reaches the final apex of both patterns simultaneously, volatility drops to historic lows. This dual-compression structure signals that JASMY is nearing the end of its multi-month consolidation, preparing for a high-volume directional explosion.
📊 Market Bias
🔴 Bearish: 65%
🟢 Bullish: 35%
The bias may change if a confirmed breakout from the descending trendline or a breakdown below the major support occurs.
⚠️ Disclaimer: Not Financial Advice (NFA). Always Do Your Own Research (DYOR) before entering any position.
💬 Are you accumulating inside this macro accumulation zone or waiting for the weekly breakout close? Share your price targets below! 👇
#JASMY #JASMYUSDT #Crypto #jasmyustd #FallingWedge #DescendingTriangle #Breakout #Altcoins #TechnicalAnalysis