Been watching $KASPA and honestly, the chart's been pretty clean lately.
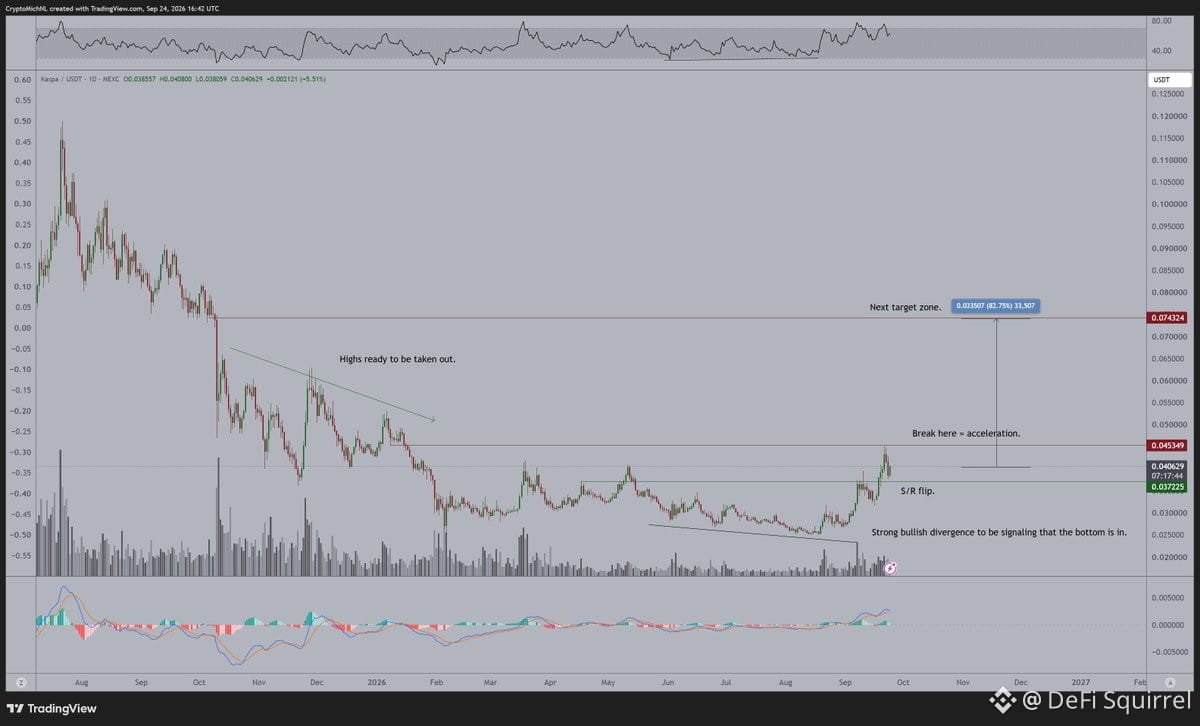
When it bottomed out, there was this obvious bullish divergence — price making lower lows while momentum was quietly building. Classic setup that actually played out.
Since then? Just textbook higher highs, higher lows. Each level that used to be resistance keeps flipping to support. It's the kind of structure you want to see when something's got legs.
If it breaks the recent high, I'm eyeing $0.0743 next. Not saying it's guaranteed, but the momentum's there and the chart's cooperating. Sometimes that's all you need.
Not trying to call a top or bottom here — just saying the vibe's been solid and the structure's holding up. We'll see if it keeps going or needs to cool off first.
When it bottomed out, there was this obvious bullish divergence — price making lower lows while momentum was quietly building. Classic setup that actually played out.
Since then? Just textbook higher highs, higher lows. Each level that used to be resistance keeps flipping to support. It's the kind of structure you want to see when something's got legs.
If it breaks the recent high, I'm eyeing $0.0743 next. Not saying it's guaranteed, but the momentum's there and the chart's cooperating. Sometimes that's all you need.
Not trying to call a top or bottom here — just saying the vibe's been solid and the structure's holding up. We'll see if it keeps going or needs to cool off first.