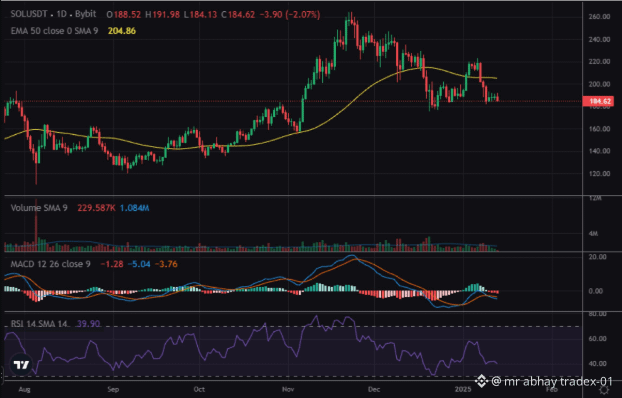
$SOL 📊 Current Market Snapshot
SOL is trading around $115.34, down about 2.57% over 24 hours according to CoinMarketCap's September 24 analysis. The recent move follows a strong rally: CoinCodex data shows SOL closed around $111.03 on Sept. 19, $118.53 on Sept. 21, and $114.94 on Sept. 23.
The recent rally has been significant. One current report puts SOL's seven-day gain at about 17.7%, although the token remains well below its 2025 peak.
📈 Important Technical Levels
Resistance zone:
🔴 $119–$120 — SOL recently reached this area and then pulled back. A sustained move above this zone would be an important technical development to monitor.
First support:
🟢 Around $114 — CoinMarketCap identifies $114.01 as a Fibonacci support level.
Next support:
🟢 Around $110–$111 — recent trading data shows SOL repeatedly interacted with this area.
Major lower zone:
🟡 Around $100–$102 — September trading data shows this was an important area before the latest rally.
🔥 What Is Driving SOL?
1. Strong recent price momentum
SOL moved from roughly $98.66 on Sept. 16 to above $118 by Sept. 21, showing a sharp short-term recovery.
2. Network activity
Recent reports say Solana's monthly on-chain transactions exceeded 5 billion, while the price also broke above a long-term descending trendline.
3. Upcoming Alpenglow upgrade
The Solana ecosystem is preparing for the Alpenglow upgrade, with current reporting pointing to September 28 as an important date. The upgrade is intended to improve transaction finality and network performance.
4. Institutional/ecosystem developments
Solana's official news page reports developments involving tokenized funds, payments and tokenized stocks, while recent reporting also highlights institutional adoption efforts.
SOL is trading around $115.34, down about 2.57% over 24 hours according to CoinMarketCap's September 24 analysis. The recent move follows a strong rally: CoinCodex data shows SOL closed around $111.03 on Sept. 19, $118.53 on Sept. 21, and $114.94 on Sept. 23.
The recent rally has been significant. One current report puts SOL's seven-day gain at about 17.7%, although the token remains well below its 2025 peak.
📈 Important Technical Levels
Resistance zone:
🔴 $119–$120 — SOL recently reached this area and then pulled back. A sustained move above this zone would be an important technical development to monitor.
First support:
🟢 Around $114 — CoinMarketCap identifies $114.01 as a Fibonacci support level.
Next support:
🟢 Around $110–$111 — recent trading data shows SOL repeatedly interacted with this area.
Major lower zone:
🟡 Around $100–$102 — September trading data shows this was an important area before the latest rally.
🔥 What Is Driving SOL?
1. Strong recent price momentum
SOL moved from roughly $98.66 on Sept. 16 to above $118 by Sept. 21, showing a sharp short-term recovery.
2. Network activity
Recent reports say Solana's monthly on-chain transactions exceeded 5 billion, while the price also broke above a long-term descending trendline.
3. Upcoming Alpenglow upgrade
The Solana ecosystem is preparing for the Alpenglow upgrade, with current reporting pointing to September 28 as an important date. The upgrade is intended to improve transaction finality and network performance.
4. Institutional/ecosystem developments
Solana's official news page reports developments involving tokenized funds, payments and tokenized stocks, while recent reporting also highlights institutional adoption efforts.