🔥 RAY IS BREAKING OUT OF A MULTI YEAR RANGE — THE WEEKLY STRUCTURE JUST CHANGED
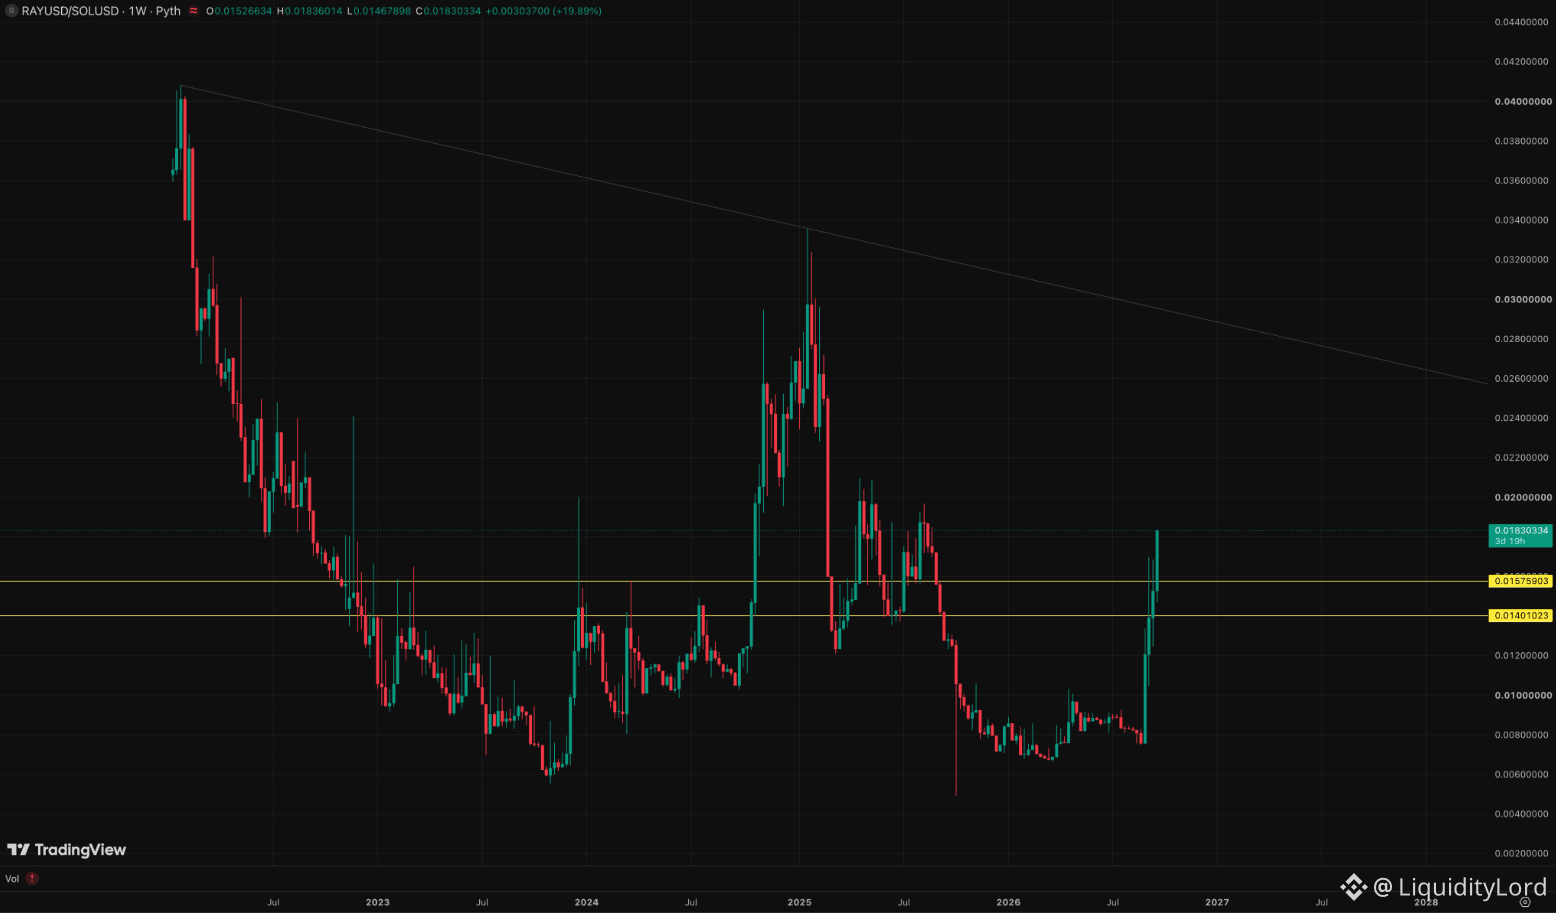
RAY/SOL on the 1W chart is around 0.0183 after a powerful weekly expansion from a long accumulation area. Price has reclaimed the marked resistance levels and is now testing the first major zone created by the previous range.
🧭 THE WEEKLY STRUCTURE IS SHIFTING
The broader chart shows a prolonged decline followed by several attempts to build a durable base. Earlier rallies were repeatedly rejected, but the latest move is different: price has pushed through both marked levels with strong momentum and is now holding above them.
That turns former resistance into an important reaction zone. A successful retest would strengthen the breakout structure.
🎯 TRADE PARAMETERS
Entry: 0.0158–0.0180
Invalidation: 0.0138
TP1: 0.0200
TP2: 0.0240
TP3: 0.0300
I would not chase a vertical weekly candle. The cleaner setup would be a controlled pullback toward the reclaimed area, followed by stabilization and renewed demand.
A sustained move below the reclaimed zone would weaken the breakout and suggest that the market still needs more time to build a base.
📊 WHY THIS CHART MATTERS
RAY has spent years trading below the descending trendline, and this expansion is the first clear attempt in the visible chart to challenge that long term structure.
⚙ A DIFFERENT EXECUTION ANGLE
ST0Nfi adds a separate DeFi perspective through non-custodial swap execution and liquidity routing. Users can review the expected transaction outcome before confirming a swap instead of focusing only on the headline price. This makes execution conditions easier to understand when liquidity is fragmented across markets.
For RAY, the key question is whether the breakout can turn old resistance into durable support. For ST0Nfi, the focus remains on making onchain swapping more transparent and practical for users.
NFA - DYOR
$RAY
RAY/SOL on the 1W chart is around 0.0183 after a powerful weekly expansion from a long accumulation area. Price has reclaimed the marked resistance levels and is now testing the first major zone created by the previous range.
🧭 THE WEEKLY STRUCTURE IS SHIFTING
The broader chart shows a prolonged decline followed by several attempts to build a durable base. Earlier rallies were repeatedly rejected, but the latest move is different: price has pushed through both marked levels with strong momentum and is now holding above them.
That turns former resistance into an important reaction zone. A successful retest would strengthen the breakout structure.
🎯 TRADE PARAMETERS
Entry: 0.0158–0.0180
Invalidation: 0.0138
TP1: 0.0200
TP2: 0.0240
TP3: 0.0300
I would not chase a vertical weekly candle. The cleaner setup would be a controlled pullback toward the reclaimed area, followed by stabilization and renewed demand.
A sustained move below the reclaimed zone would weaken the breakout and suggest that the market still needs more time to build a base.
📊 WHY THIS CHART MATTERS
RAY has spent years trading below the descending trendline, and this expansion is the first clear attempt in the visible chart to challenge that long term structure.
⚙ A DIFFERENT EXECUTION ANGLE
ST0Nfi adds a separate DeFi perspective through non-custodial swap execution and liquidity routing. Users can review the expected transaction outcome before confirming a swap instead of focusing only on the headline price. This makes execution conditions easier to understand when liquidity is fragmented across markets.
For RAY, the key question is whether the breakout can turn old resistance into durable support. For ST0Nfi, the focus remains on making onchain swapping more transparent and practical for users.
NFA - DYOR
$RAY