ZEC IS COMPRESSING INSIDE A TRIANGLE — THE NEXT EXPANSION MATTERS
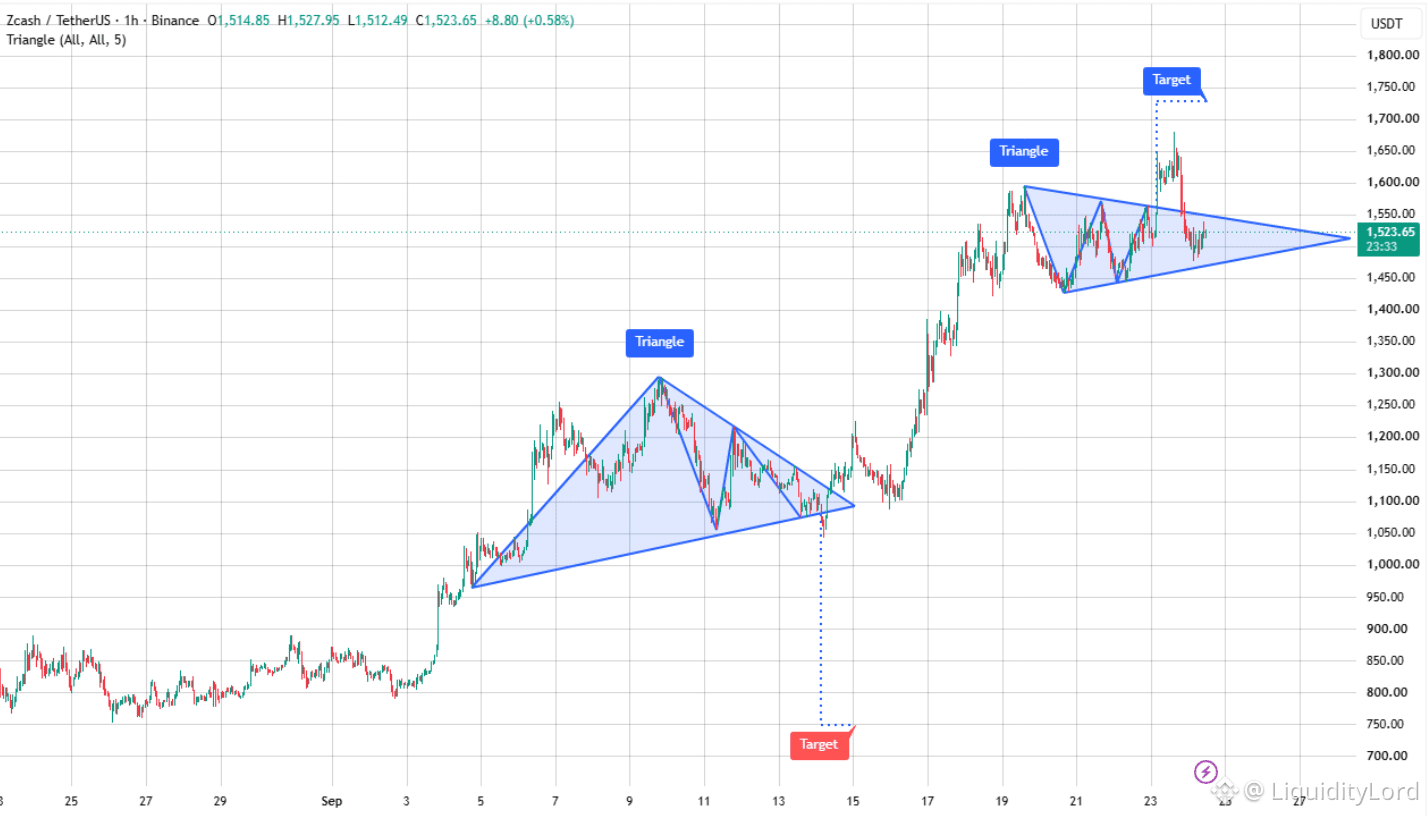
ZEC/USDT on the 1H chart is around 1,523 after a strong advance from the lower 1,100 area. Price is now moving inside a contracting triangle after reaching above 1,600. Each swing is becoming more contained as the pattern approaches its apex.
🧭 THE PATTERN IS GETTING TIGHTER
The chart shows repeated reactions from the upper boundary and defenses of the rising lower trendline. That creates a compression structure. A decisive break should provide more information than the current sideways movement.
The marked upside target sits around 1,750, while 1,650 is the first area that needs to be reclaimed. If the lower boundary fails, the triangle loses strength and price can rotate toward the previous breakout zone.
🎯 TRADE PARAMETERS
Entry: 1,500–1,530
Invalidation: 1,420
TP1: 1,650
TP2: 1,750
TP3: 1,800
I would rather wait for confirmation from the triangle than chase every move inside it. Once price escapes the structure, volatility can expand quickly.
📊 THE BREAKOUT NEEDS ACCEPTANCE
Momentum alone is not enough after such a strong advance. What matters now is whether buyers defend the rising boundary as price approaches the apex. A sustained breakout carries more weight than a brief wick above resistance. Volume and follow-through would strengthen the signal.
⚙ A DIFFERENT EXECUTION ANGLE
ST0Nfi focuses on DeFi execution, where liquidity and routing can affect the final result of a swap. Its approach gives users more visibility into execution conditions between the quote and confirmation. This infrastructure perspective is separate from the ZEC chart and does not validate the setup.
For now, the triangle is the main structure to watch. A clean expansion above the upper boundary brings the marked zones into focus. A breakdown would invalidate the setup and require a fresh read.
NFA - DYOR
$ZEC
ZEC/USDT on the 1H chart is around 1,523 after a strong advance from the lower 1,100 area. Price is now moving inside a contracting triangle after reaching above 1,600. Each swing is becoming more contained as the pattern approaches its apex.
🧭 THE PATTERN IS GETTING TIGHTER
The chart shows repeated reactions from the upper boundary and defenses of the rising lower trendline. That creates a compression structure. A decisive break should provide more information than the current sideways movement.
The marked upside target sits around 1,750, while 1,650 is the first area that needs to be reclaimed. If the lower boundary fails, the triangle loses strength and price can rotate toward the previous breakout zone.
🎯 TRADE PARAMETERS
Entry: 1,500–1,530
Invalidation: 1,420
TP1: 1,650
TP2: 1,750
TP3: 1,800
I would rather wait for confirmation from the triangle than chase every move inside it. Once price escapes the structure, volatility can expand quickly.
📊 THE BREAKOUT NEEDS ACCEPTANCE
Momentum alone is not enough after such a strong advance. What matters now is whether buyers defend the rising boundary as price approaches the apex. A sustained breakout carries more weight than a brief wick above resistance. Volume and follow-through would strengthen the signal.
⚙ A DIFFERENT EXECUTION ANGLE
ST0Nfi focuses on DeFi execution, where liquidity and routing can affect the final result of a swap. Its approach gives users more visibility into execution conditions between the quote and confirmation. This infrastructure perspective is separate from the ZEC chart and does not validate the setup.
For now, the triangle is the main structure to watch. A clean expansion above the upper boundary brings the marked zones into focus. A breakdown would invalidate the setup and require a fresh read.
NFA - DYOR
$ZEC