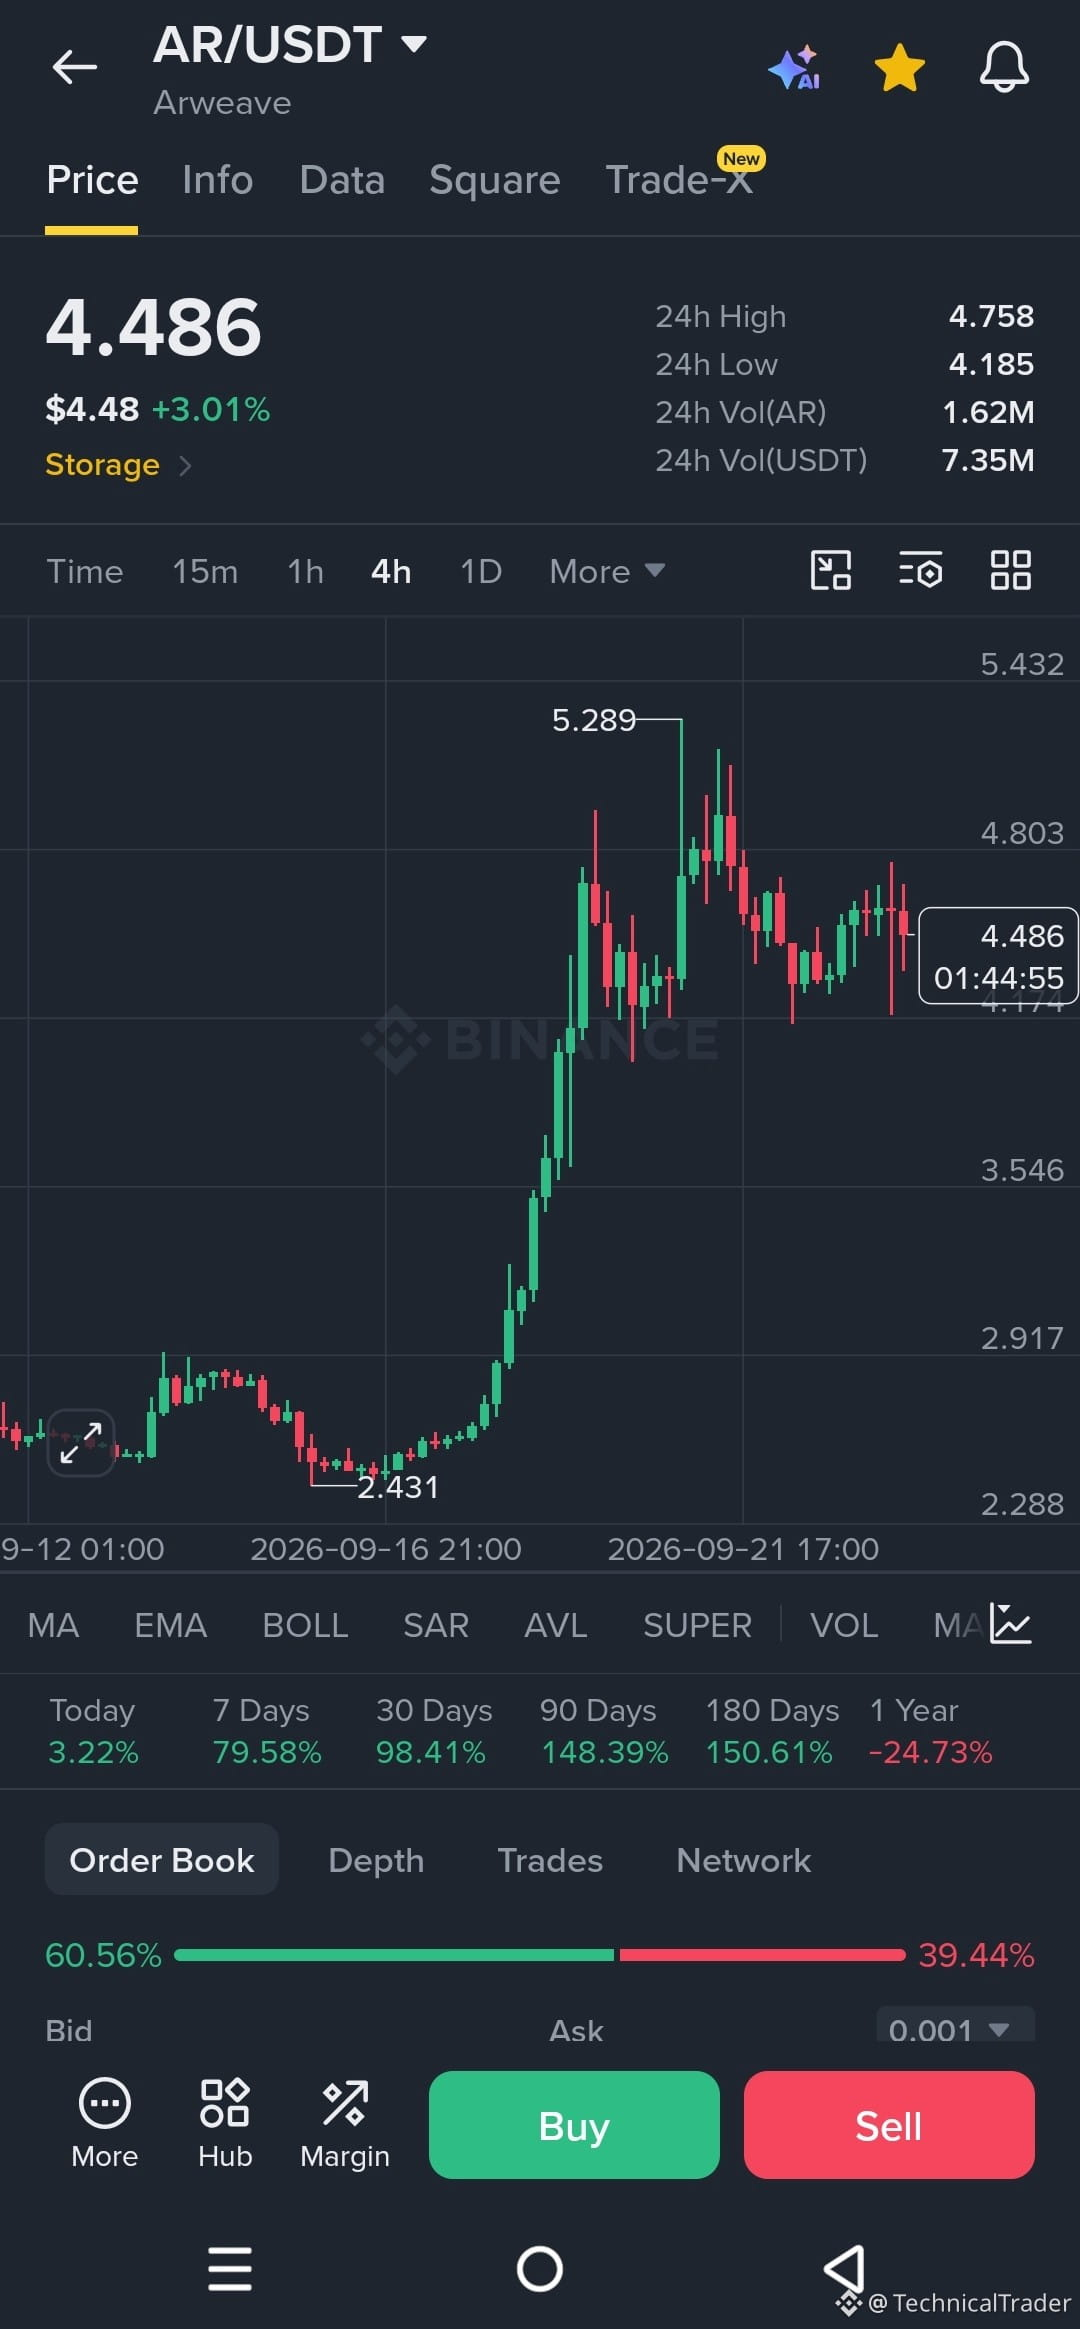
$AR has made a massive move from $2.43 to $5.29 but now the chart is showing a completely different battle 👀 Price has been moving sideways below the recent high, and the next breakout could decide the next leg.
On the 4H chart, the bigger structure is still strongly bullish after the sharp move from $2.431. But after reaching $5.289, price was rejected and entered a consolidation range roughly between $4.20 and $4.80.
The first major resistance is $4.803, followed by the recent high at $5.289. A clean breakout and hold above $4.803 could bring $5.289 back into focus.
On the downside, $4.20–$4.30 is the key nearby support area. If that zone holds, buyers could attempt another push upward. But a clear break below it would weaken the current consolidation structure and could expose the lower area around $3.546.
The order book currently shows 60.56% bids vs 39.44% asks, although that's only a snapshot and doesn't confirm the next move.
So I'm watching $4.803 for the upside breakout and $4.20–$4.30 for the downside reaction. A sustained move above $4.803 would strengthen the continuation scenario, while losing the $4.20 area would make the deeper support levels more important.
Guys, follow for more chart analysis 😎 I’ll keep showing you exactly what the chart is telling us. 👀🔥
On the 4H chart, the bigger structure is still strongly bullish after the sharp move from $2.431. But after reaching $5.289, price was rejected and entered a consolidation range roughly between $4.20 and $4.80.
The first major resistance is $4.803, followed by the recent high at $5.289. A clean breakout and hold above $4.803 could bring $5.289 back into focus.
On the downside, $4.20–$4.30 is the key nearby support area. If that zone holds, buyers could attempt another push upward. But a clear break below it would weaken the current consolidation structure and could expose the lower area around $3.546.
The order book currently shows 60.56% bids vs 39.44% asks, although that's only a snapshot and doesn't confirm the next move.
So I'm watching $4.803 for the upside breakout and $4.20–$4.30 for the downside reaction. A sustained move above $4.803 would strengthen the continuation scenario, while losing the $4.20 area would make the deeper support levels more important.
Guys, follow for more chart analysis 😎 I’ll keep showing you exactly what the chart is telling us. 👀🔥