$BTC /USDT Technical Analysis 📊
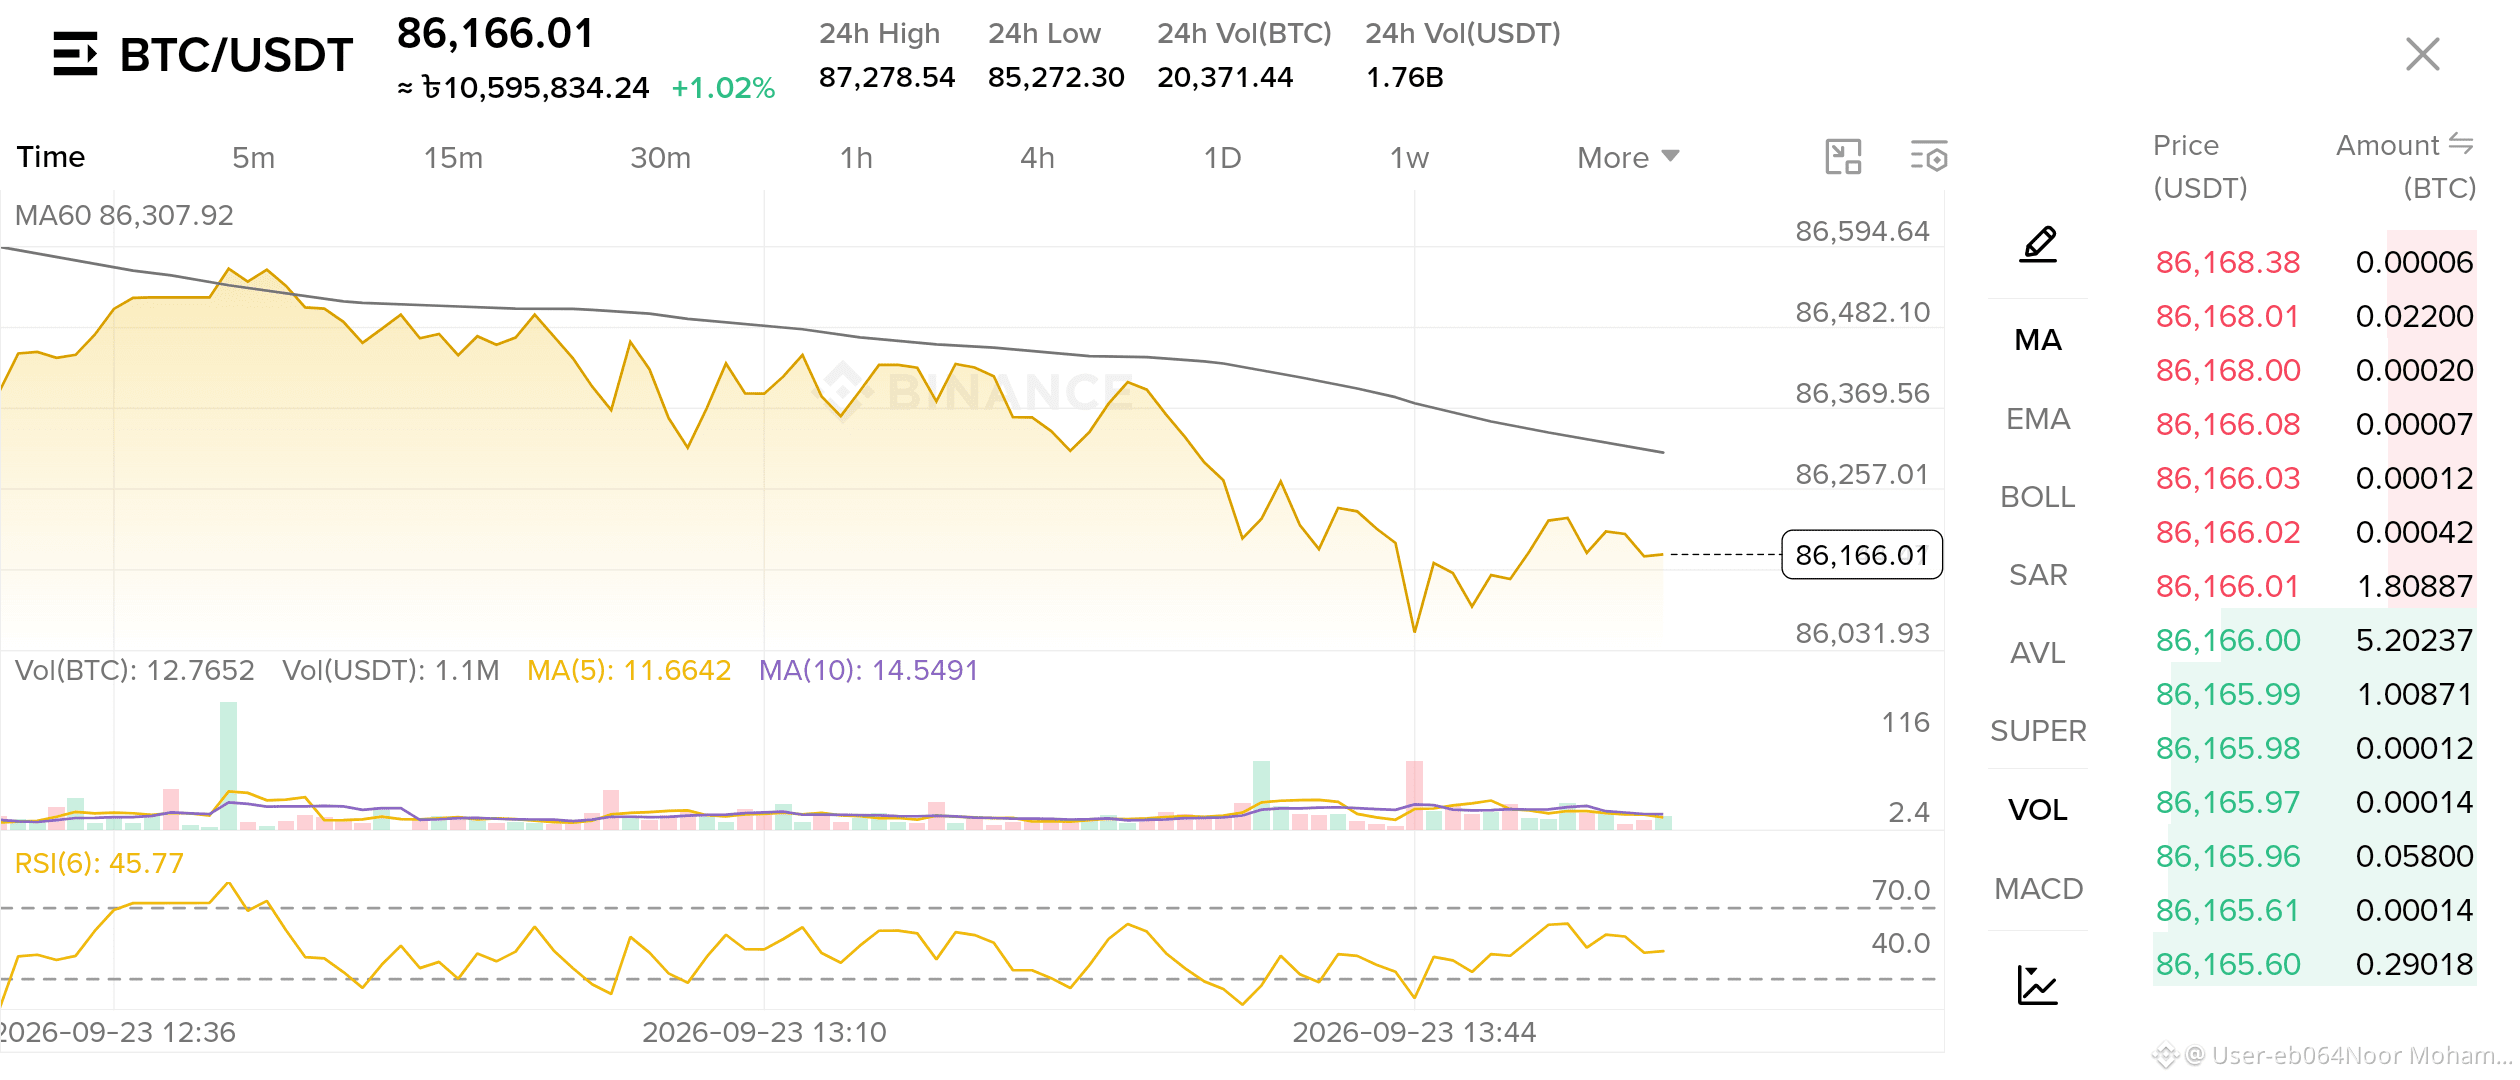
Based on the chart, $BTC is showing short-term bearish momentum.
Current Price: ~$86,166
MA60: ~$86,308 → Price is trading below MA60
RSI(6): 45.77 → Neutral, but no strong bullish momentum
Structure: Lower highs and lower lows are visible
Support: ~$86,030
Resistance: ~$86,300–86,400
📉 Potential Direction: SHORT / SELL
A possible setup could be considered if$
BTC rejects the $86,250–$86,350 resistance area.
Potential Targets:
🎯 TP1: $86,050
🎯 TP2: $85,850
🛑 Stop Loss: Above $86,450
⚠️ This is a chart-based scenario, not a guaranteed signal. Wait for confirmation before entering a trade and manage risk carefully.
Based on the chart, $BTC is showing short-term bearish momentum.
Current Price: ~$86,166
MA60: ~$86,308 → Price is trading below MA60
RSI(6): 45.77 → Neutral, but no strong bullish momentum
Structure: Lower highs and lower lows are visible
Support: ~$86,030
Resistance: ~$86,300–86,400
📉 Potential Direction: SHORT / SELL
A possible setup could be considered if$
BTC rejects the $86,250–$86,350 resistance area.
Potential Targets:
🎯 TP1: $86,050
🎯 TP2: $85,850
🛑 Stop Loss: Above $86,450
⚠️ This is a chart-based scenario, not a guaranteed signal. Wait for confirmation before entering a trade and manage risk carefully.