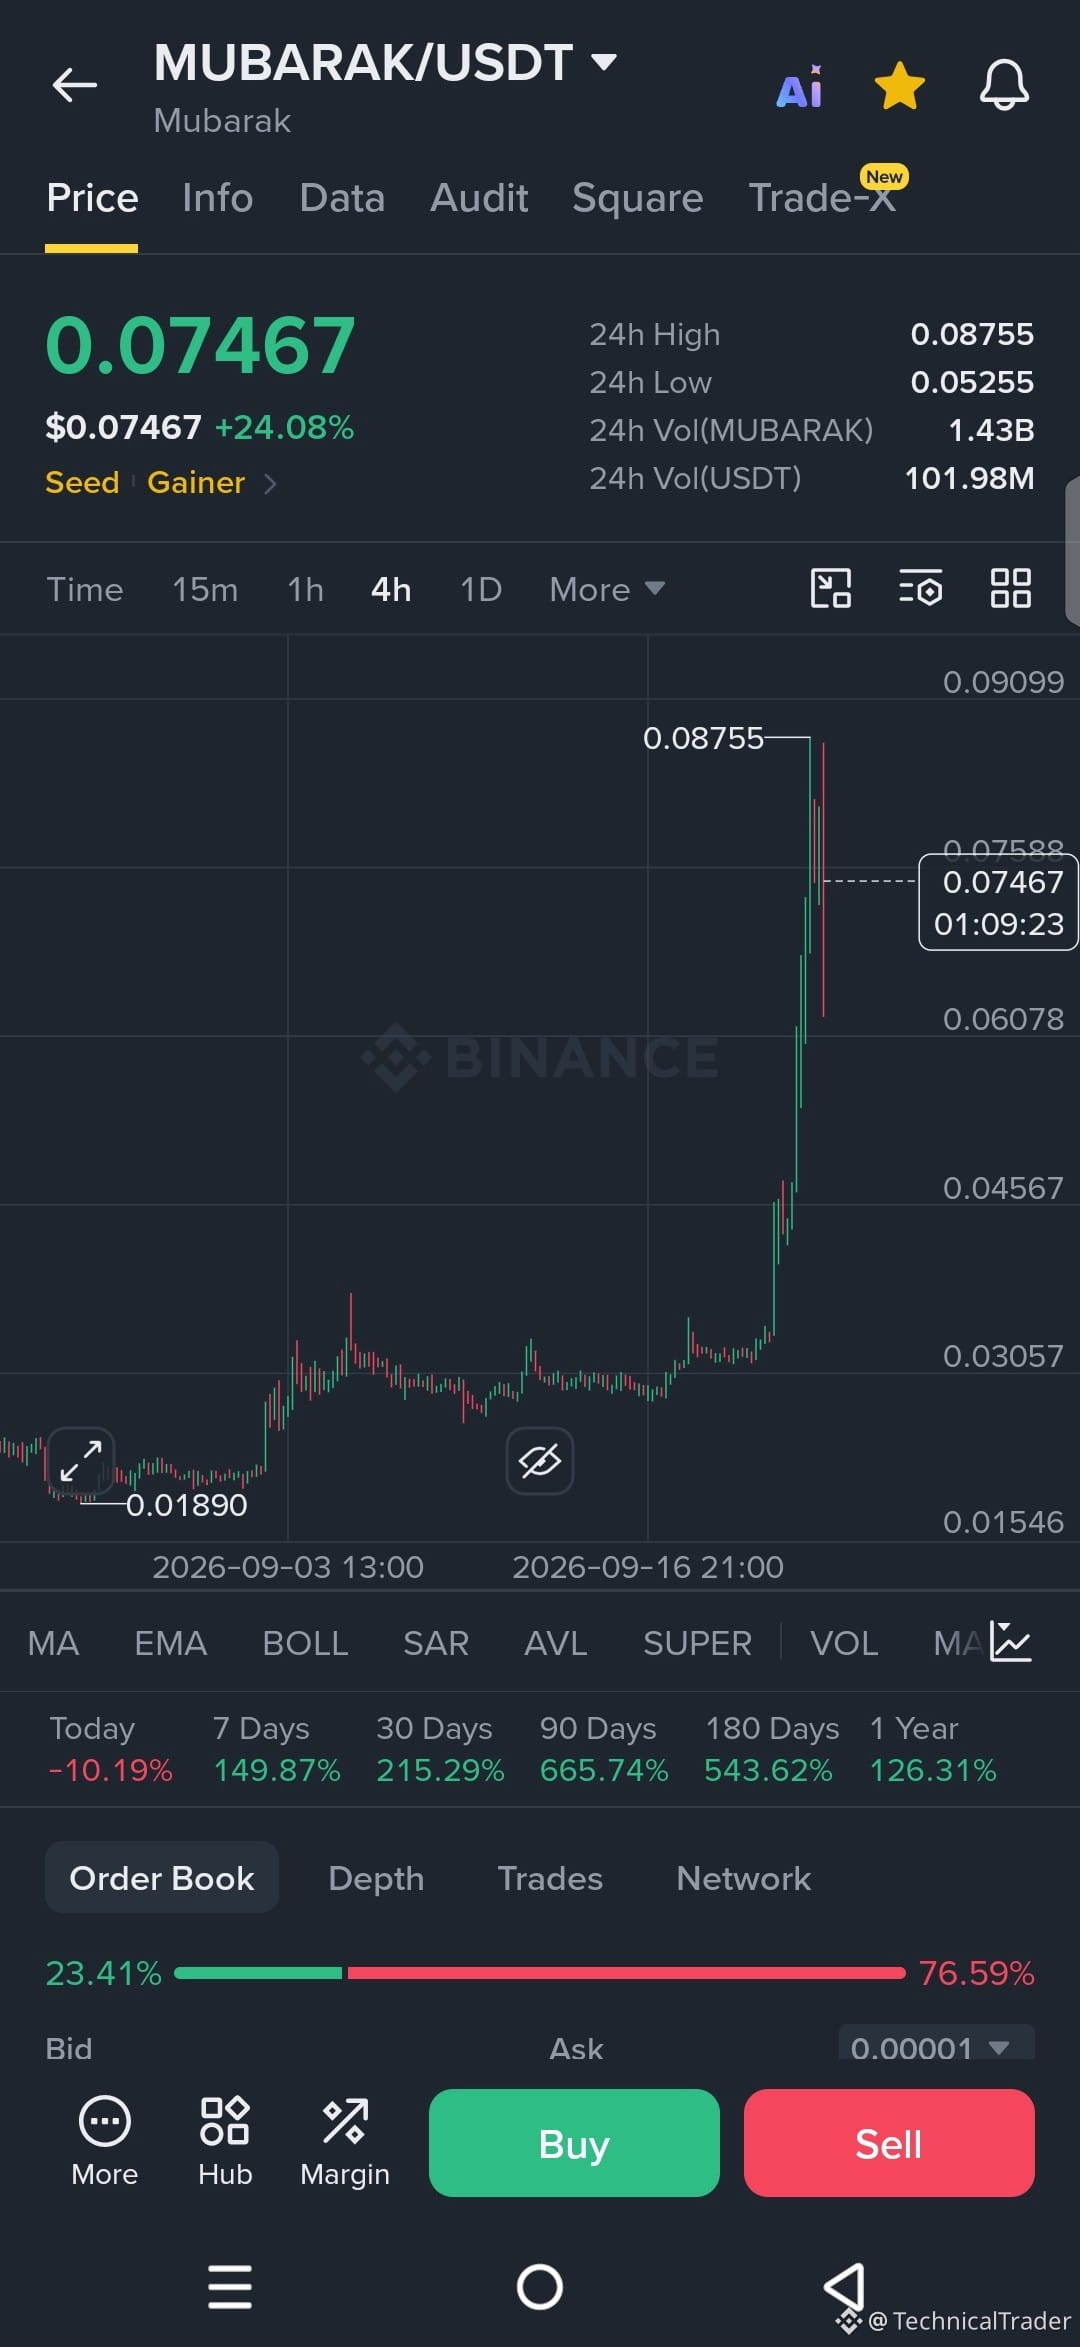
Look at this $MUBARAK chart… that vertical rocket from the lows around 0.01890 straight up to 0.08755 is wild. Price just ripped and is now sitting at 0.07467 after a sharp rejection off the high.
What we’re seeing is a clear strong impulse higher on the 4H. Price spent a long time grinding and chopping in the lower range, then buyers stepped in hard and pushed it into a near-vertical move. Higher highs and higher lows are printed throughout that rally. The candle that tagged 0.08755 got rejected pretty quickly and we’re now pulling back, but the overall structure from the breakout remains intact so far.
Key levels that stand out: the recent high at 0.08755 is the immediate resistance and liquidity area overhead. Below, the zone around 0.060–0.065 where the vertical move started accelerating looks like a potential demand pocket. The 0.045 area was previous resistance that got left behind. No indicators are really adding extra weight here beyond the pure price action and volume spike that came with the pump.
Bullish continuation would need buyers to defend the current pullback and reclaim above 0.080, ideally pushing back toward that 0.08755 high and beyond. A clean hold and higher low formation would keep the momentum alive.
On the downside, if price starts accepting below the 0.060 region and breaks the structure of the recent impulse, we could see a deeper retrace toward the 0.045 area or even lower into the previous range.
Right now the focus is whether this pullback finds support and continues the upward structure or if sellers take control and force a larger correction. The 0.08755 high and the 0.060 zone are the two levels that will tell us the next move.
Guys, follow for more chart analysis 😎 I’ll keep showing you exactly what the chart is telling us. 👀🔥
What we’re seeing is a clear strong impulse higher on the 4H. Price spent a long time grinding and chopping in the lower range, then buyers stepped in hard and pushed it into a near-vertical move. Higher highs and higher lows are printed throughout that rally. The candle that tagged 0.08755 got rejected pretty quickly and we’re now pulling back, but the overall structure from the breakout remains intact so far.
Key levels that stand out: the recent high at 0.08755 is the immediate resistance and liquidity area overhead. Below, the zone around 0.060–0.065 where the vertical move started accelerating looks like a potential demand pocket. The 0.045 area was previous resistance that got left behind. No indicators are really adding extra weight here beyond the pure price action and volume spike that came with the pump.
Bullish continuation would need buyers to defend the current pullback and reclaim above 0.080, ideally pushing back toward that 0.08755 high and beyond. A clean hold and higher low formation would keep the momentum alive.
On the downside, if price starts accepting below the 0.060 region and breaks the structure of the recent impulse, we could see a deeper retrace toward the 0.045 area or even lower into the previous range.
Right now the focus is whether this pullback finds support and continues the upward structure or if sellers take control and force a larger correction. The 0.08755 high and the 0.060 zone are the two levels that will tell us the next move.
Guys, follow for more chart analysis 😎 I’ll keep showing you exactly what the chart is telling us. 👀🔥