$XAG
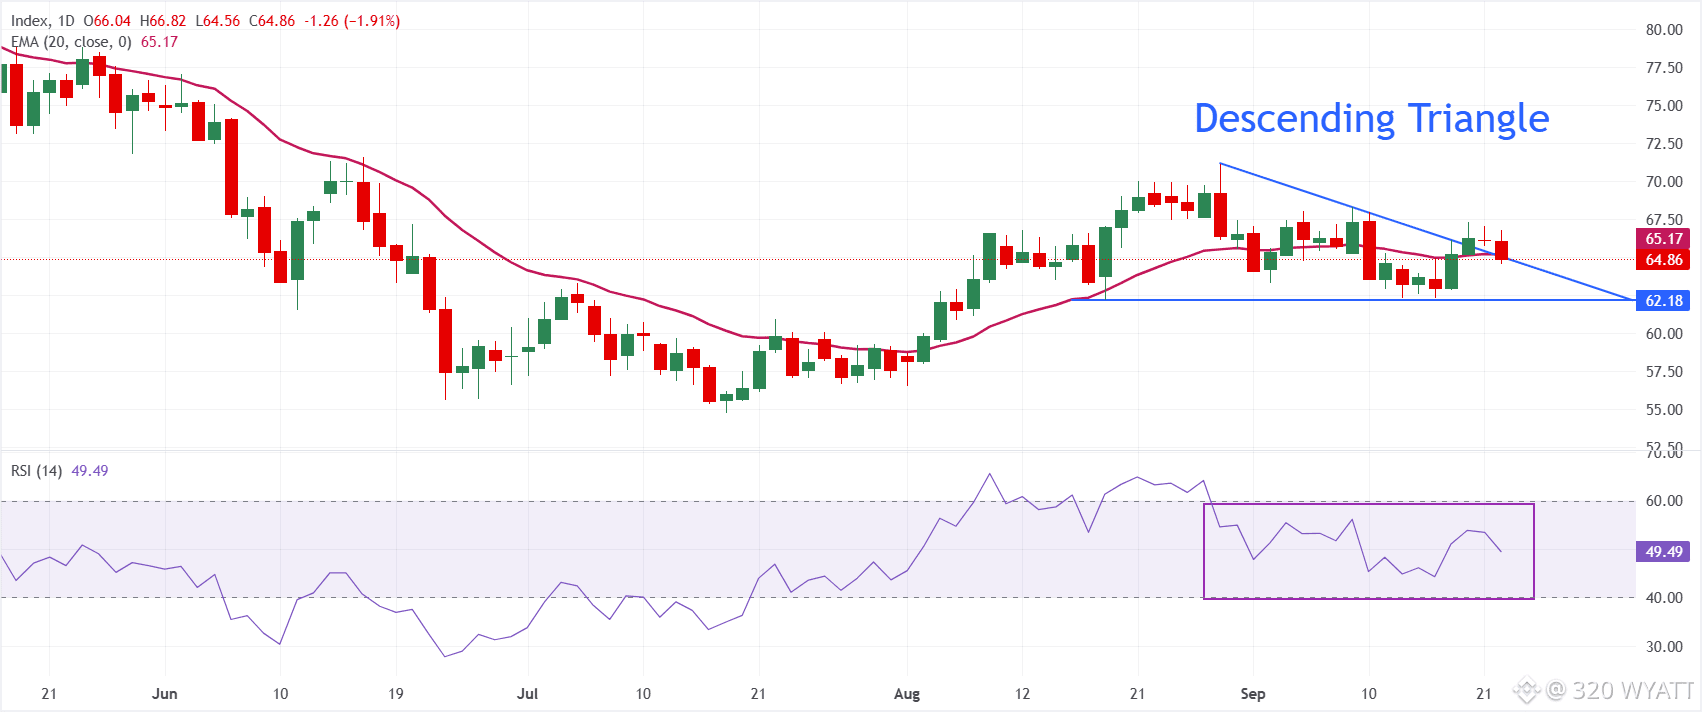
In the daily chart, XAG/USD trades at $64.90, keeping a bearish near-term tone as it remains capped by the 20-day Moving Average Exponential (EMA) at $65.18. Price trades close to the broken downward resistance trend line, while the Relative Strength Index (14) around 50 hints at neutral momentum that fails to offset the overhead technical barriers.
On the topside, initial resistance is located at the 20-day EMA at $65.18, which continues to limit recovery attempts in the short term. On the downside, the former resistance trend line turning into support around $64.26 is the first level to watch, as a daily close below this area would likely expose XAG/USD to renewed selling pressure.
#silver320 #mr320 #Trendingissue #Trendingcoin320 #WriteToEarn2026
In the daily chart, XAG/USD trades at $64.90, keeping a bearish near-term tone as it remains capped by the 20-day Moving Average Exponential (EMA) at $65.18. Price trades close to the broken downward resistance trend line, while the Relative Strength Index (14) around 50 hints at neutral momentum that fails to offset the overhead technical barriers.
On the topside, initial resistance is located at the 20-day EMA at $65.18, which continues to limit recovery attempts in the short term. On the downside, the former resistance trend line turning into support around $64.26 is the first level to watch, as a daily close below this area would likely expose XAG/USD to renewed selling pressure.
#silver320 #mr320 #Trendingissue #Trendingcoin320 #WriteToEarn2026