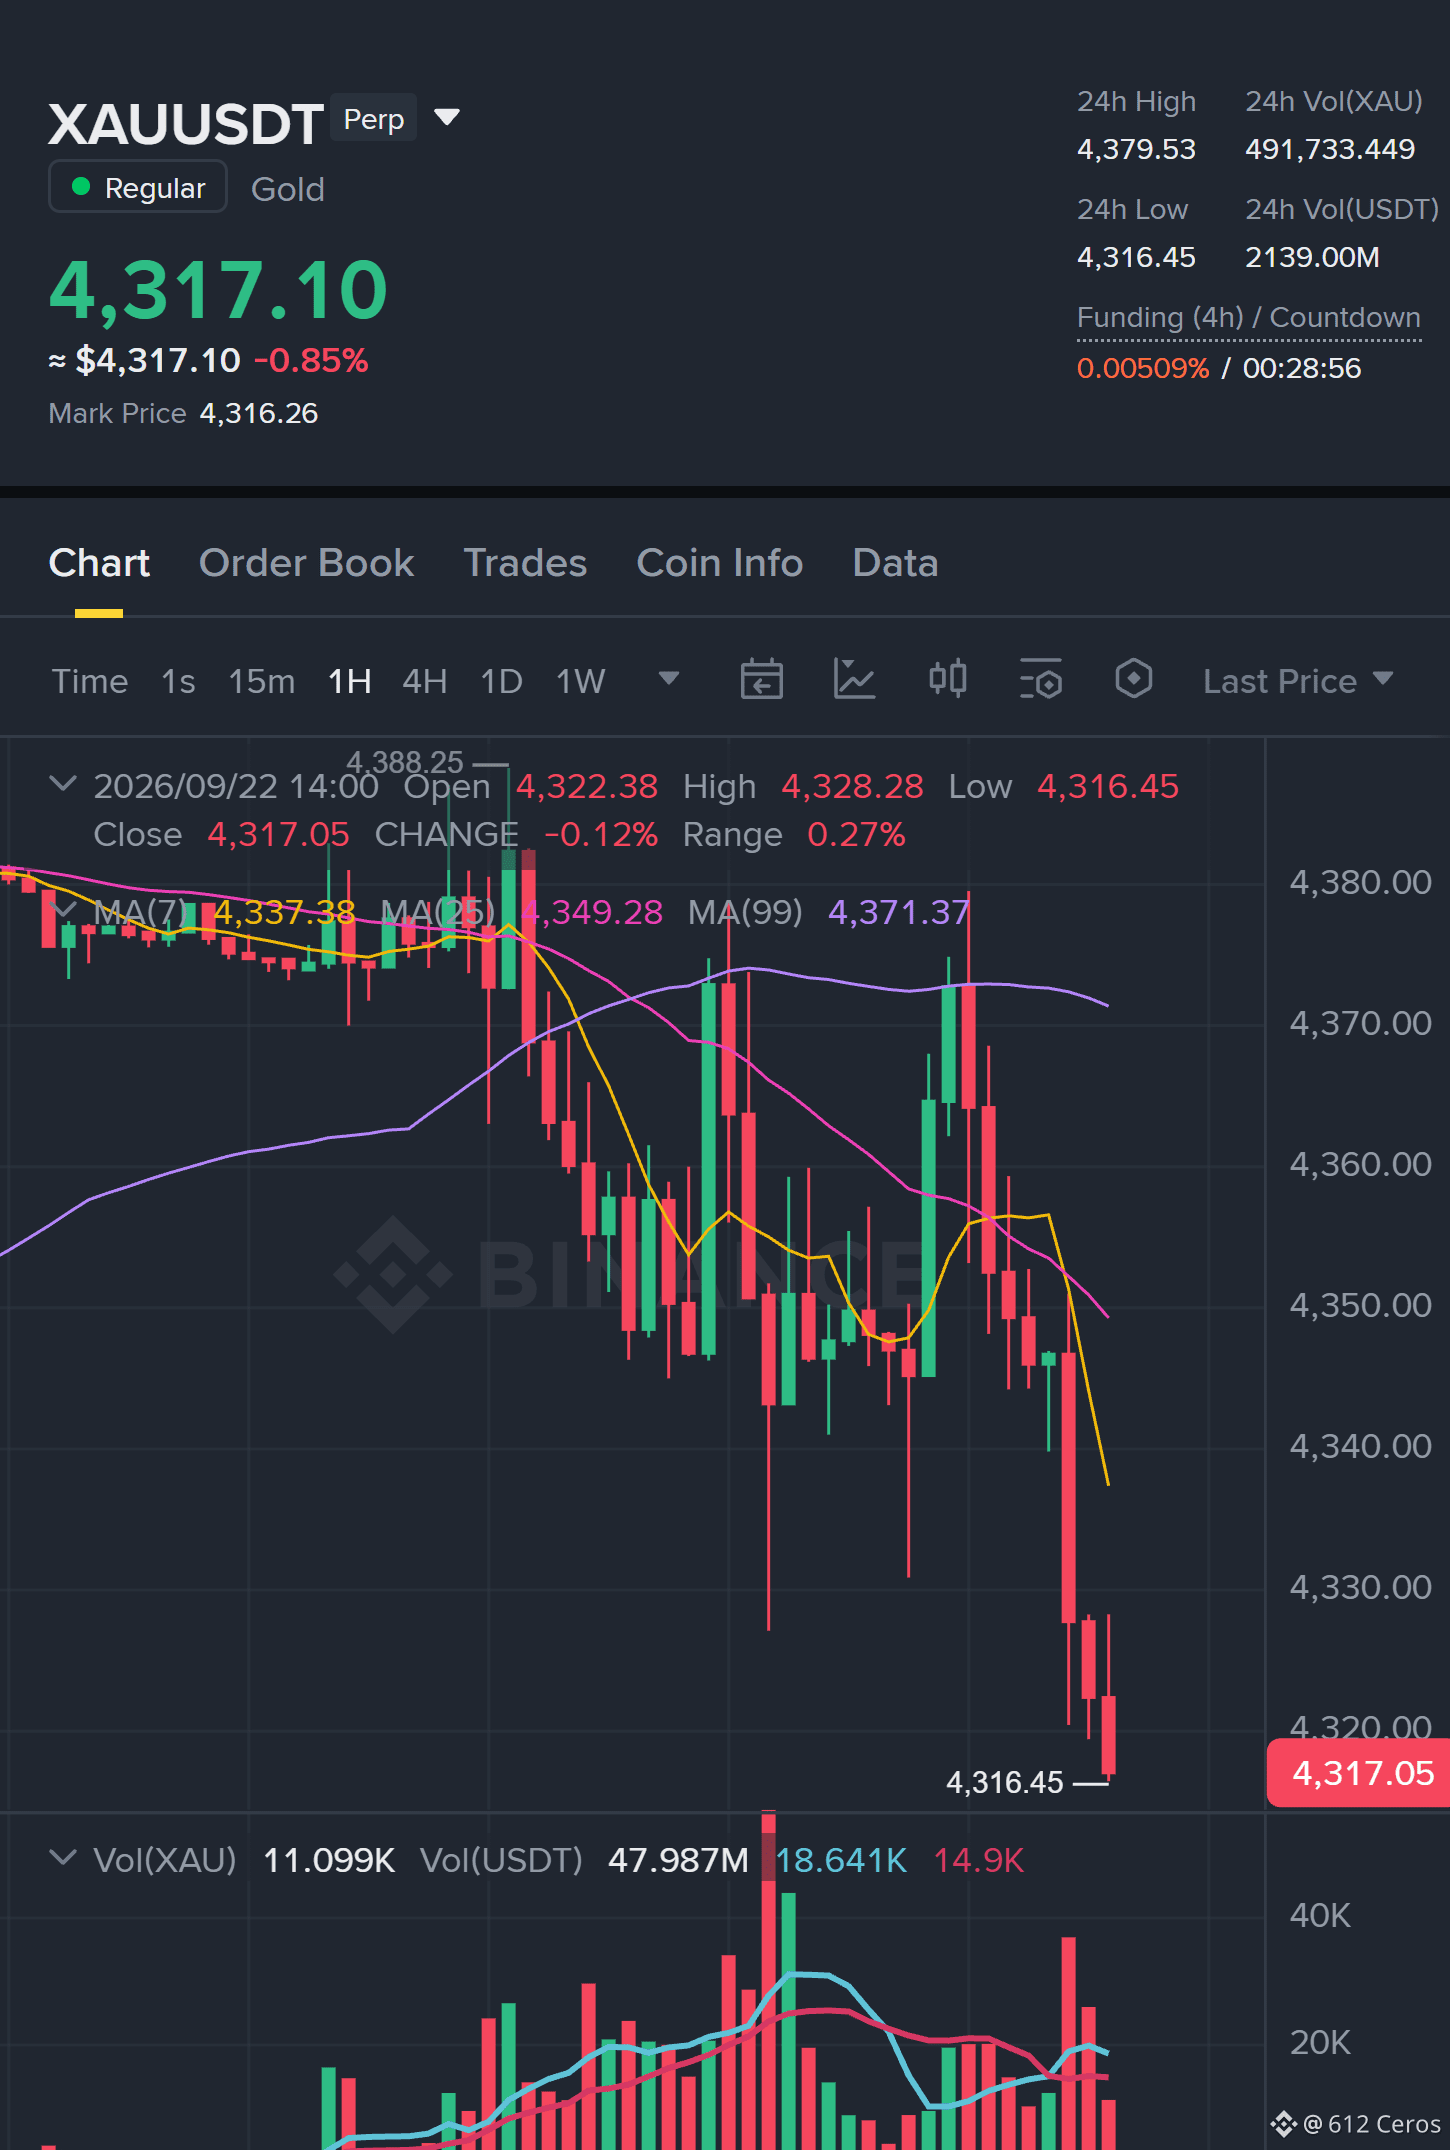
XAU's daily bearish stack is not a myth if you read the EMAs.
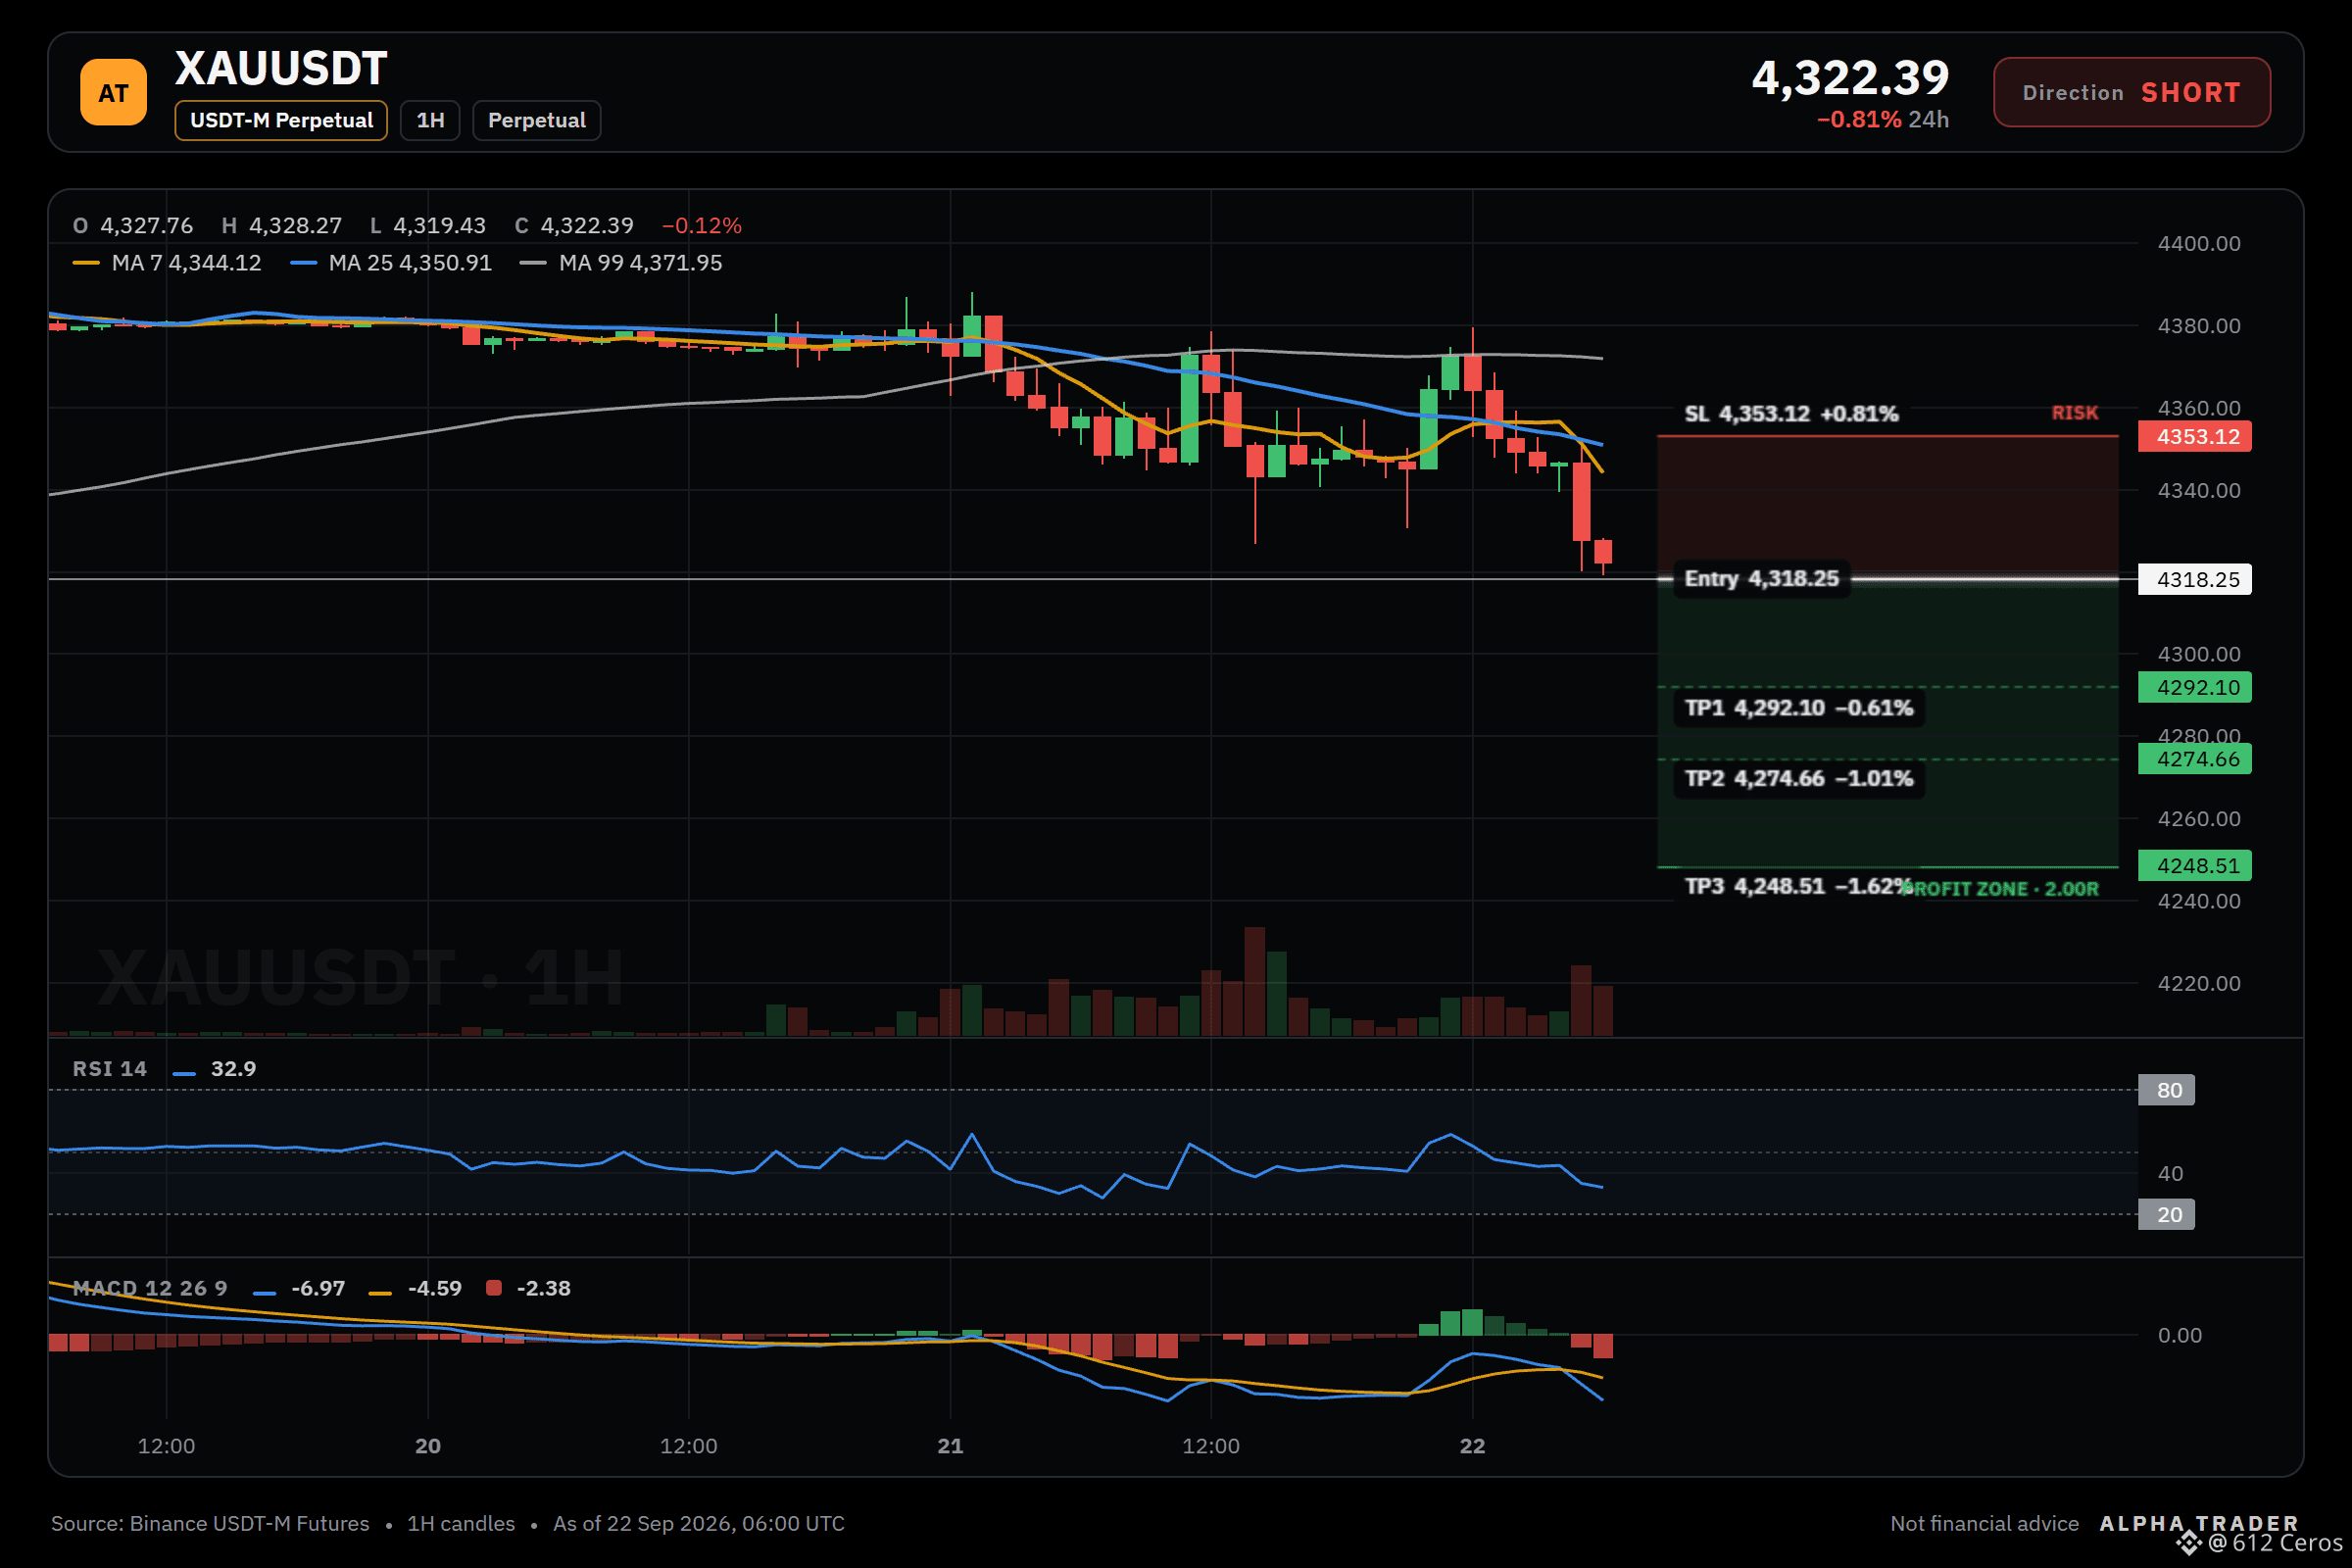
🔴 $XAU /USDT | Bias: SHORT (Strong) | 7/12 signals aligned
Technical verdict: STRONG SHORT. 7 of 12 signals aligned, 0 against.
What supports it (7):
• Daily trend: price < EMA50 < EMA200, bearish stack
• 4h trend: price < EMA50 < EMA200, bearish stack
• Trend strength (ADX/DI, 15m): ADX 29.5 with sellers in control (DI+ 11.9 vs DI− 25.0)
• 4h RSI: 44.9, bearish momentum (below 45)
No factor points the other way right now.
Q: Why short XAU instead of going long on a bounce?
A: The daily trend is bearish and the 1h price is below a bearish 4h stack, with a 77.6 confidence score.
Q: Where is the precise entry zone?
A: The 1h price is 4318.25, with a valid entry between 4316.27 and 4320.23 against the 4372.66 invalid level.
Q: When does this setup become wrong?
A: A break above 4353.12 invalidates the short, as the price would be trading back above the 1h entry high.
Price map:
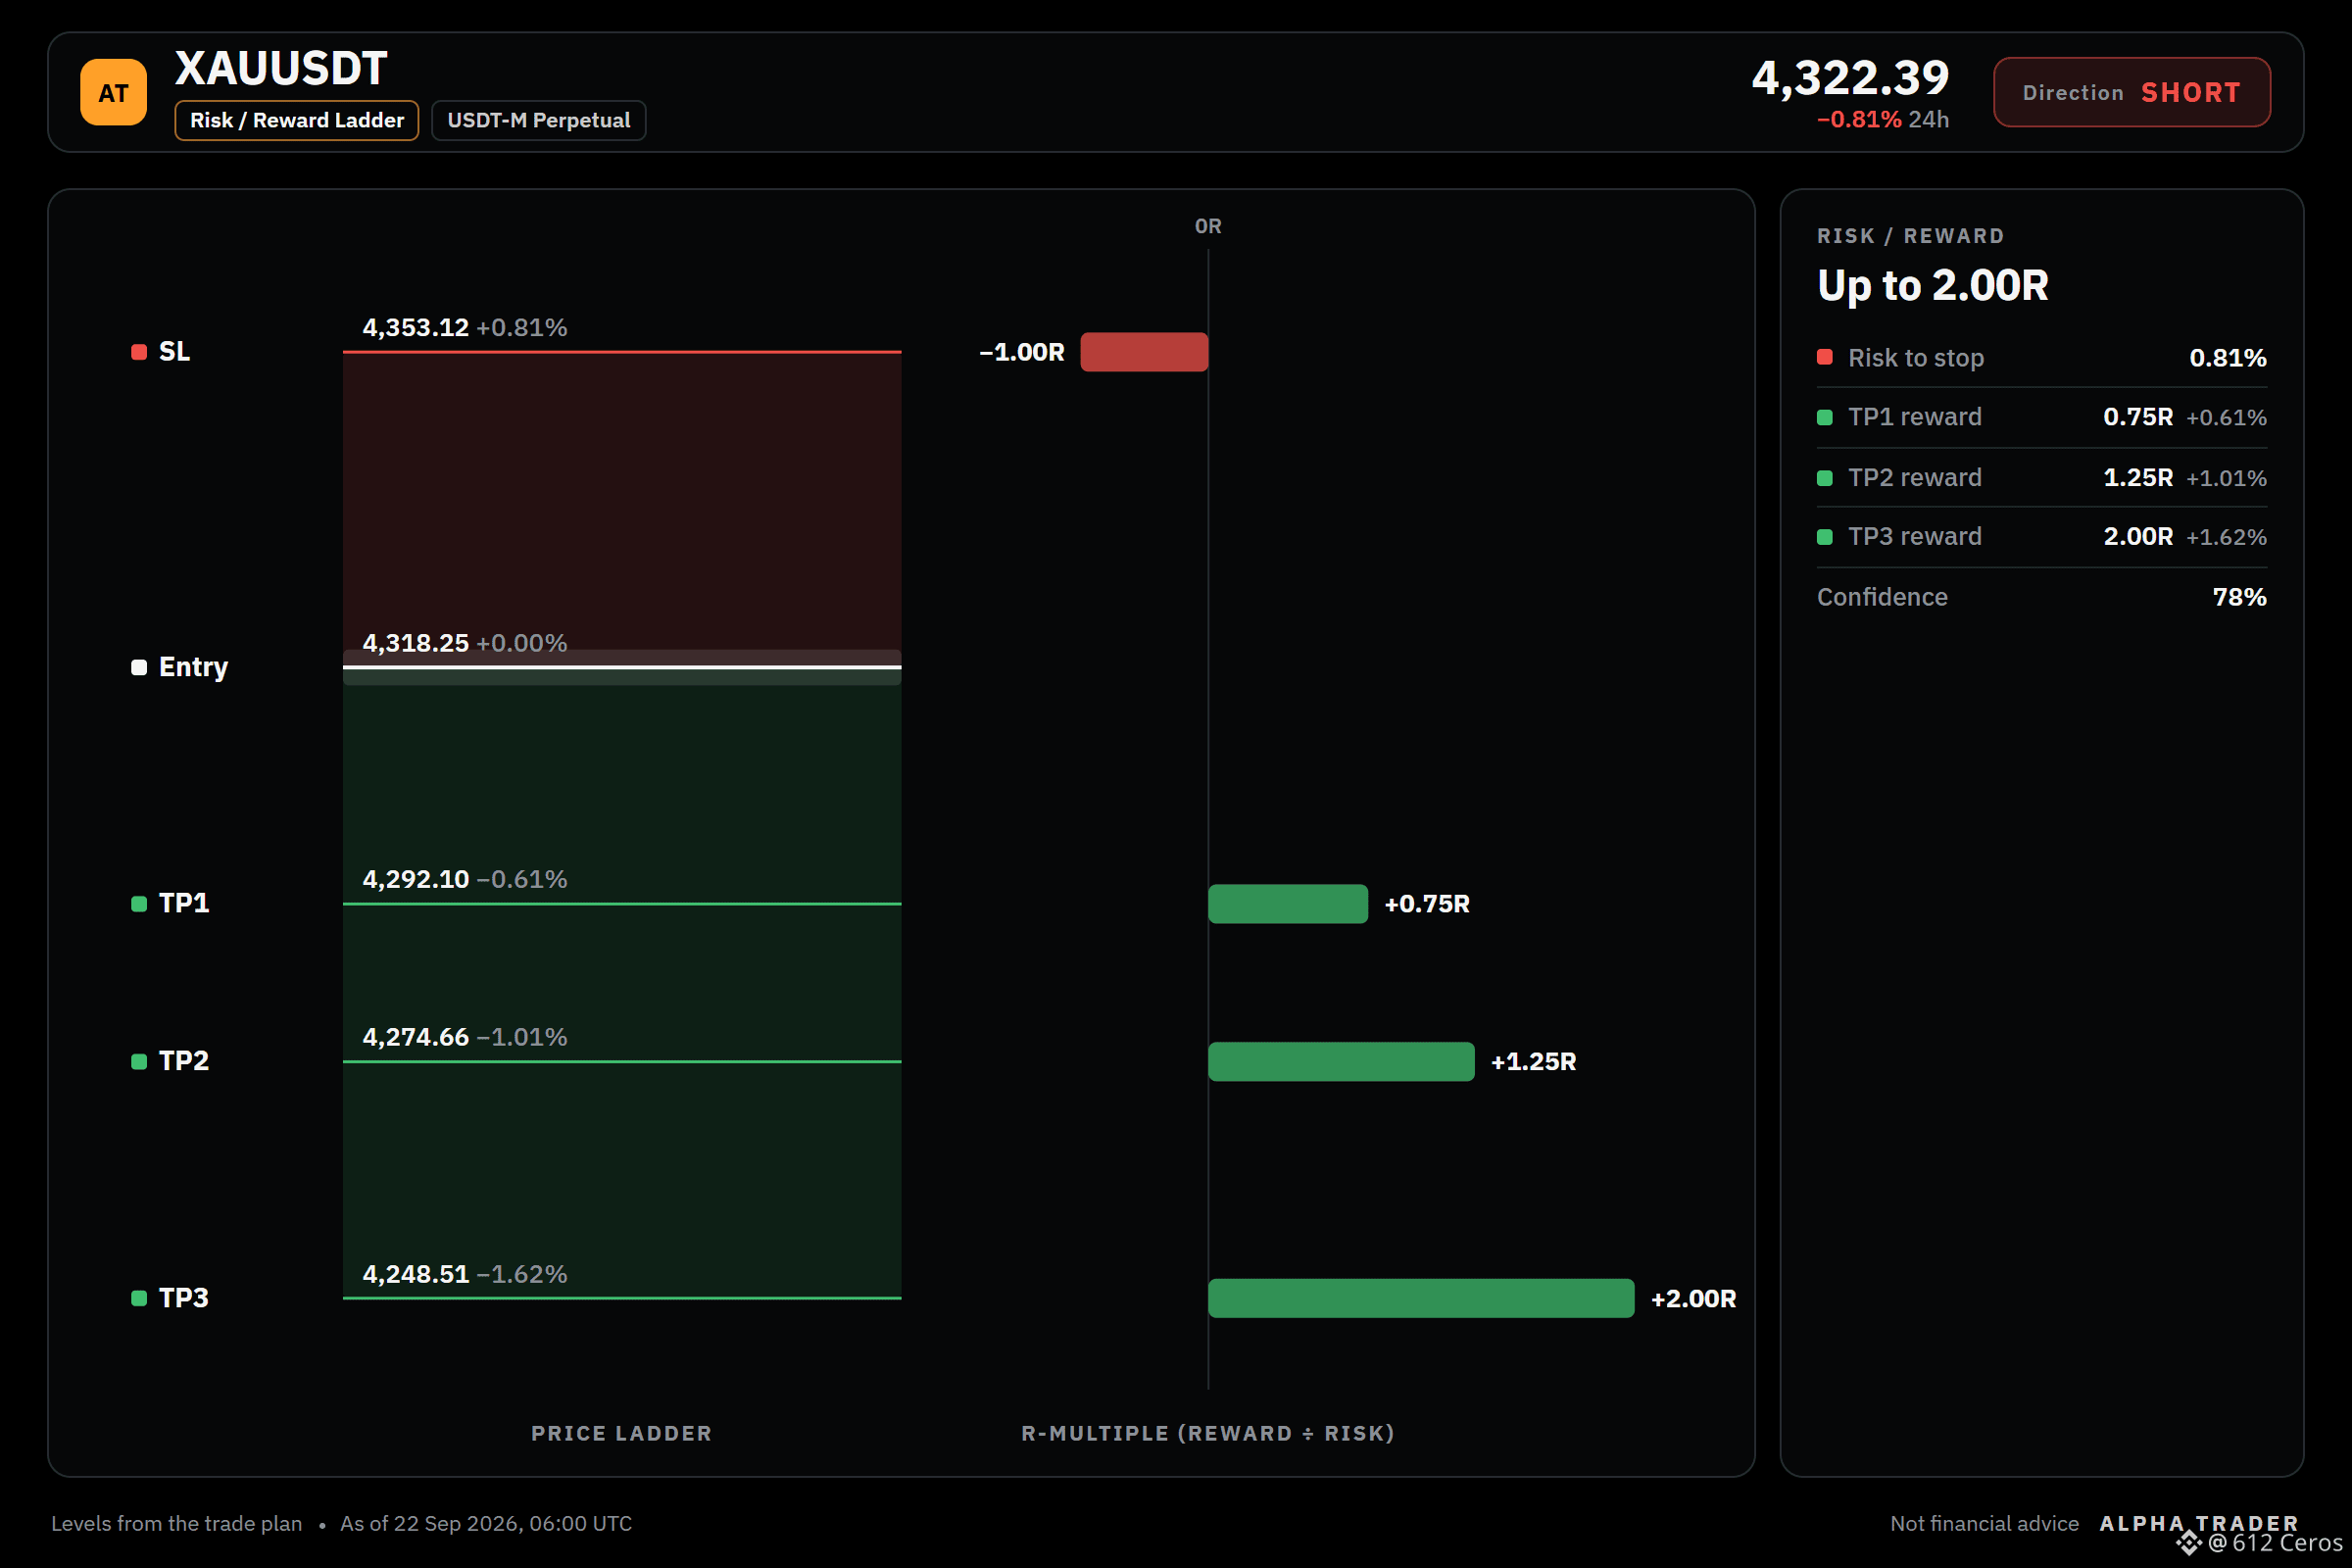
🛑 SL: 4353.12
📍 Entry: 4316.27 – 4320.23
🎯 TP1: 4292.10
🎯 TP2: 4274.66
🎯 TP3: 4248.51
Debate:
What is your entry if XAU breaks above 4353.12 before reaching 4316.27?
Click here to view the chart 👇️
⚠️ Personal market analysis only. NFA — manage risk and DYOR.
Educational content, not investment advice or a recommendation to buy, sell, deposit, or withdraw any asset. No paid promotion or referral/affiliate links.
🔴 $XAU /USDT | Bias: SHORT (Strong) | 7/12 signals aligned
Technical verdict: STRONG SHORT. 7 of 12 signals aligned, 0 against.
What supports it (7):
• Daily trend: price < EMA50 < EMA200, bearish stack
• 4h trend: price < EMA50 < EMA200, bearish stack
• Trend strength (ADX/DI, 15m): ADX 29.5 with sellers in control (DI+ 11.9 vs DI− 25.0)
• 4h RSI: 44.9, bearish momentum (below 45)
No factor points the other way right now.
Q: Why short XAU instead of going long on a bounce?
A: The daily trend is bearish and the 1h price is below a bearish 4h stack, with a 77.6 confidence score.
Q: Where is the precise entry zone?
A: The 1h price is 4318.25, with a valid entry between 4316.27 and 4320.23 against the 4372.66 invalid level.
Q: When does this setup become wrong?
A: A break above 4353.12 invalidates the short, as the price would be trading back above the 1h entry high.
Price map:
🛑 SL: 4353.12
📍 Entry: 4316.27 – 4320.23
🎯 TP1: 4292.10
🎯 TP2: 4274.66
🎯 TP3: 4248.51
Debate:
What is your entry if XAU breaks above 4353.12 before reaching 4316.27?
Click here to view the chart 👇️
⚠️ Personal market analysis only. NFA — manage risk and DYOR.
Educational content, not investment advice or a recommendation to buy, sell, deposit, or withdraw any asset. No paid promotion or referral/affiliate links.