
Bitcoin has delivered the kind of move that immediately attracts attention.
BTC climbed from the $80K area toward $86,344, while both the 4H and 15M charts continue to show a strong bullish structure.
But this is exactly where traders need to slow down.
A strong move does not automatically mean a strong entry.
When price is already near a fresh local high, the key question is no longer “Is Bitcoin bullish?”
The better question is:
Where can a long position be entered with controlled risk?
Today’s AltcoinWolF analysis focuses on that question.
Premium Education Post: Why Patience Beats FOMO
One of the biggest mistakes traders make during strong rallies is buying simply because candles are moving quickly.
The market can remain bullish while still producing a short-term pullback.
That distinction matters.
A disciplined trader separates:
Market direction
from
Entry timing.
Bitcoin's current structure is bullish, but the better opportunity may come from either:
A controlled pullback into support, or
A confirmed breakout above the current high followed by a retest.
The goal is not to predict every candle.
The goal is to wait for the market to provide evidence.
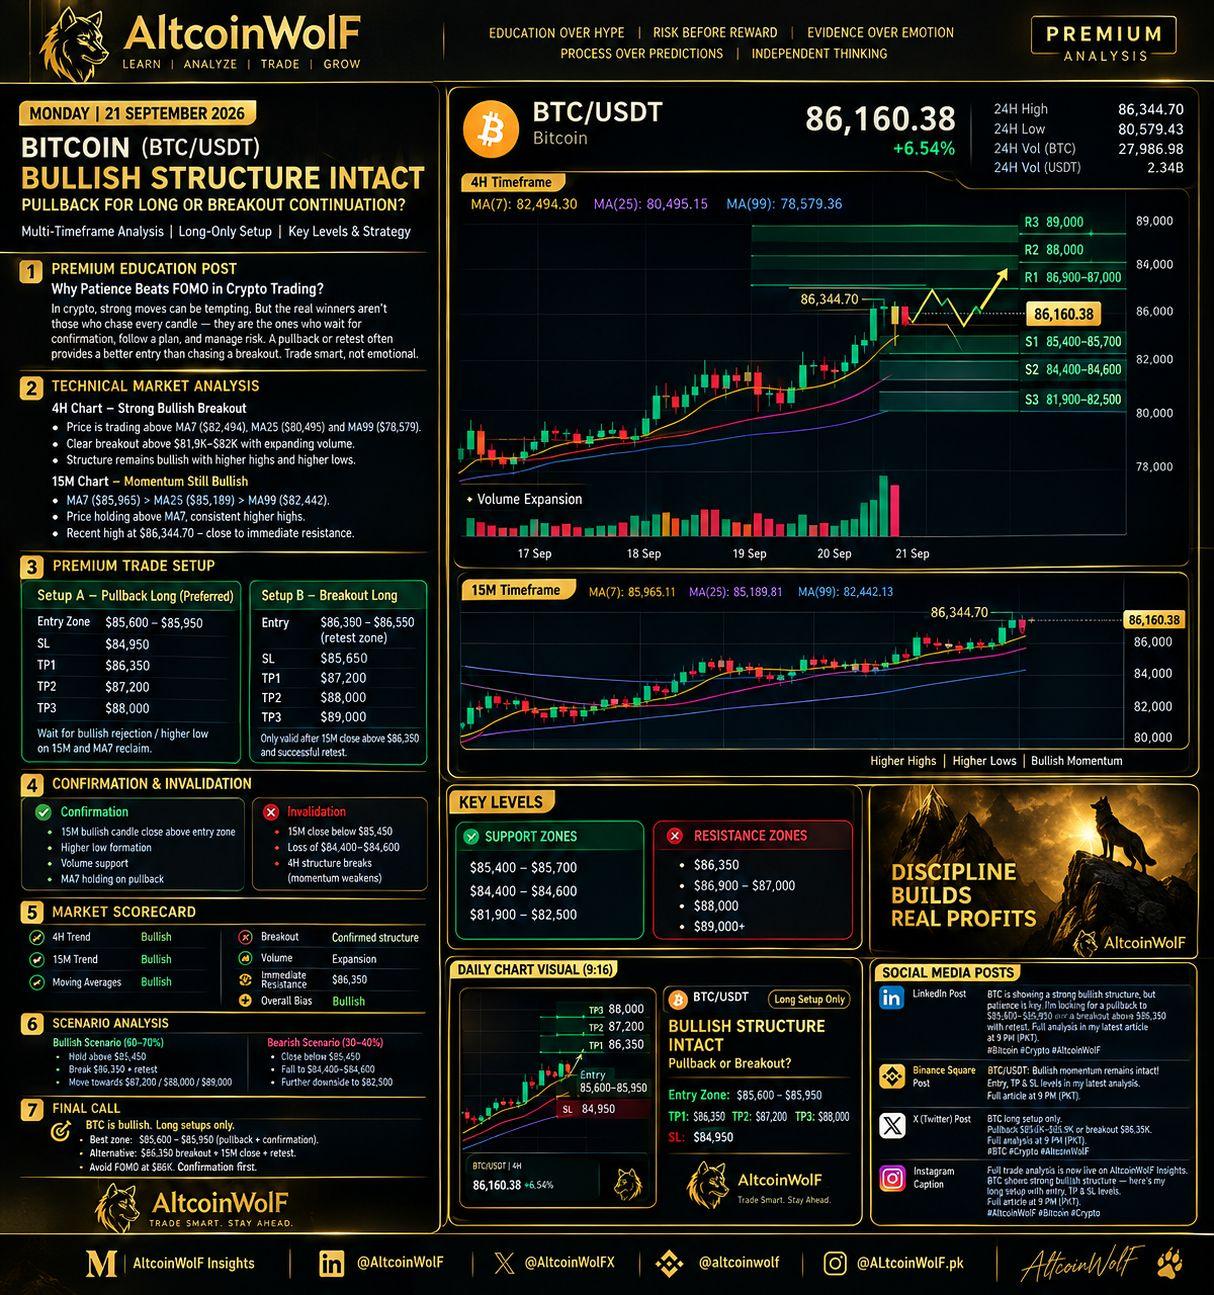
📊 Bitcoin Technical Market Analysis
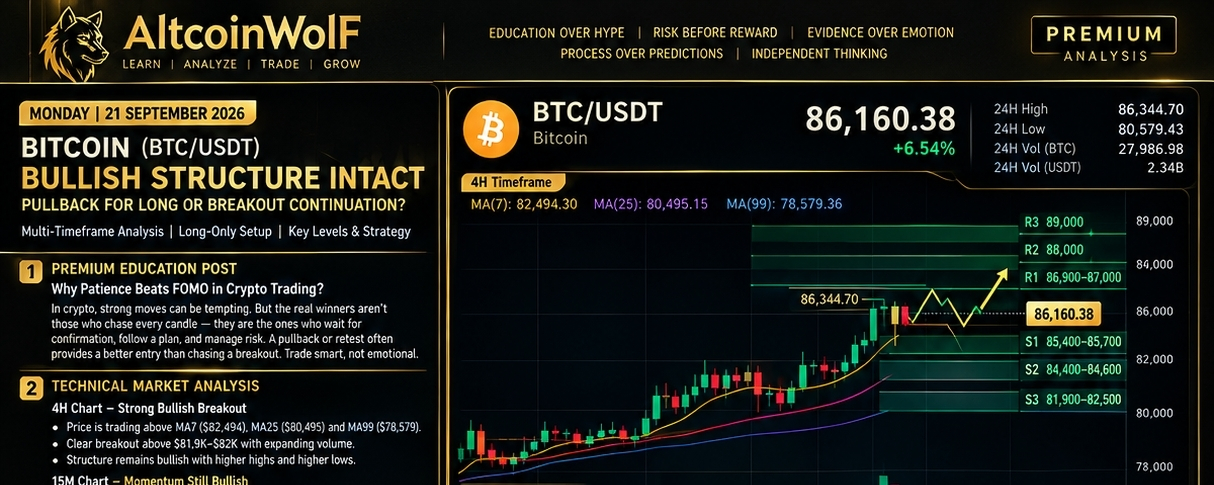
4H Timeframe — Strong Bullish Breakout
The 4H chart remains clearly constructive.
Current price is around $86,160, while the moving averages are:
MA7: $82,494
MA25: $80,495
MA99: $78,579
Price is trading significantly above all three averages.
More importantly, the recent structure shows:
Higher highs
Higher lows
Strong bullish candles
Breakout from the previous consolidation
Noticeable volume expansion
The $81.9K–$82.5K region has now become an important structural area to monitor.
As long as the broader structure remains intact, the 4H trend continues to favor the upside.
15M Timeframe — Momentum Remains Bullish
The short-term chart is also aligned with the higher timeframe.
Current moving averages:
MA7: $85,965
MA25: $85,189
MA99: $82,442
The alignment remains bullish:
MA7 > MA25 > MA99
Price is also holding above the short-term averages.
However, BTC is currently close to the $86,344.70 high, meaning immediate resistance is nearby.
This makes chasing the current candle less attractive than waiting for confirmation.
🎯 Premium Trade Setup
🟢 Setup A — Pullback Long
Preferred setup
Entry Zone: $85,600–$85,950
The setup becomes more attractive if BTC returns to this area and produces:
Bullish rejection
Higher low
15M bullish candle confirmation
MA7 support/reclaim
Trade Levels
Entry: $85,600–$85,950
Stop Loss: $84,950
TP1: $86,350
TP2: $87,200
TP3: $88,000
After TP1, traders can consider reducing risk and protecting the position rather than allowing a profitable trade to turn into a loss.
🚀 Setup B — Breakout Long
The second possibility is continuation.
If BTC produces a confirmed 15M close above $86,350 and successfully retests the breakout zone:
Entry: $86,350–$86,550
SL: $85,650
Targets
TP1: $87,200
TP2: $88,000
TP3: $89,000
The key word here is confirmed.
A temporary wick above $86,350 is not enough.
We want:
Breakout → Close → Retest → Hold → Continuation
🛡️ Confirmation & Invalidation
Confirmation
A long setup becomes stronger when:
15M candle confirms the level
BTC forms a higher low
Volume supports the move
Price maintains short-term MA structure
Previous resistance turns into support
Invalidation
The immediate bullish setup becomes weaker if:
15M closes decisively below $85,450.
A deeper loss of the $84,400–$84,600 support zone would further weaken the short-term bullish structure.
The major 4H structural area remains around $81,900–$82,500.
🧭 Key BTC Levels
Support
S1: $85,400–$85,700
S2: $84,400–$84,600
S3: $81,900–$82,500
Resistance
R1: $86,350
R2: $86,900–$87,000
R3: $88,000
R4: $89,000+
🔮 Scenario Analysis
🟢 Bullish Scenario
BTC holds above the $85.4K area and either:
A) Pulls back → forms higher low → resumes upward
or
B) Breaks $86,350 → confirms above it → retests → continues higher.
Potential upside areas:
$87,200 → $88,000 → $89,000
🔴 Bearish / Invalidated Scenario
If BTC loses $85,450 with decisive 15M weakness, the immediate long setup loses strength.
A deeper move through $84,400–$84,600 would suggest that the market needs a larger reset before another continuation attempt.
This does not automatically mean a trend reversal; it means the current long thesis requires reassessment.
📊 AltcoinWolF Market Scorecard
Factor
Reading
4H Trend
🟢 Bullish
15M Trend
🟢 Bullish
Moving Averages
🟢 Bullish
Breakout Structure
🟢 Positive
Volume
🟢 Expanded
Immediate Resistance
🟡 $86,350
Entry Risk
🟡 Avoid FOMO
Long Bias
🟢 Active
🎯 Final Call
Bitcoin's structure remains bullish across both analyzed timeframes.
But the strongest lesson from today's chart is simple:
Don't confuse bullish momentum with an invitation to chase.
The preferred approach is to wait for either:
$85,600–$85,950 pullback + bullish confirmation
or
$86,350 breakout + 15M close + successful retest.
The market does not reward the trader who enters first.
It rewards the trader who manages risk when the setup appears.
Trade smarter. Move faster. Stay ahead.
📊 Follow AltcoinWolF for high-conviction setups, precision entries, and market-leading crypto insights. 🐺⚡
The market rewards patience, not emotions. Wait for confirmation, protect your capital, and let the charts lead the way.
— AltcoinWolF
Educational market analysis only. No setup guarantees profit. Always manage position size and risk according to your own strategy.
#BitcoinHits$85K #BTC走势分析 #BTC☀️ #bitcoin #AltcoinWolF $BTC