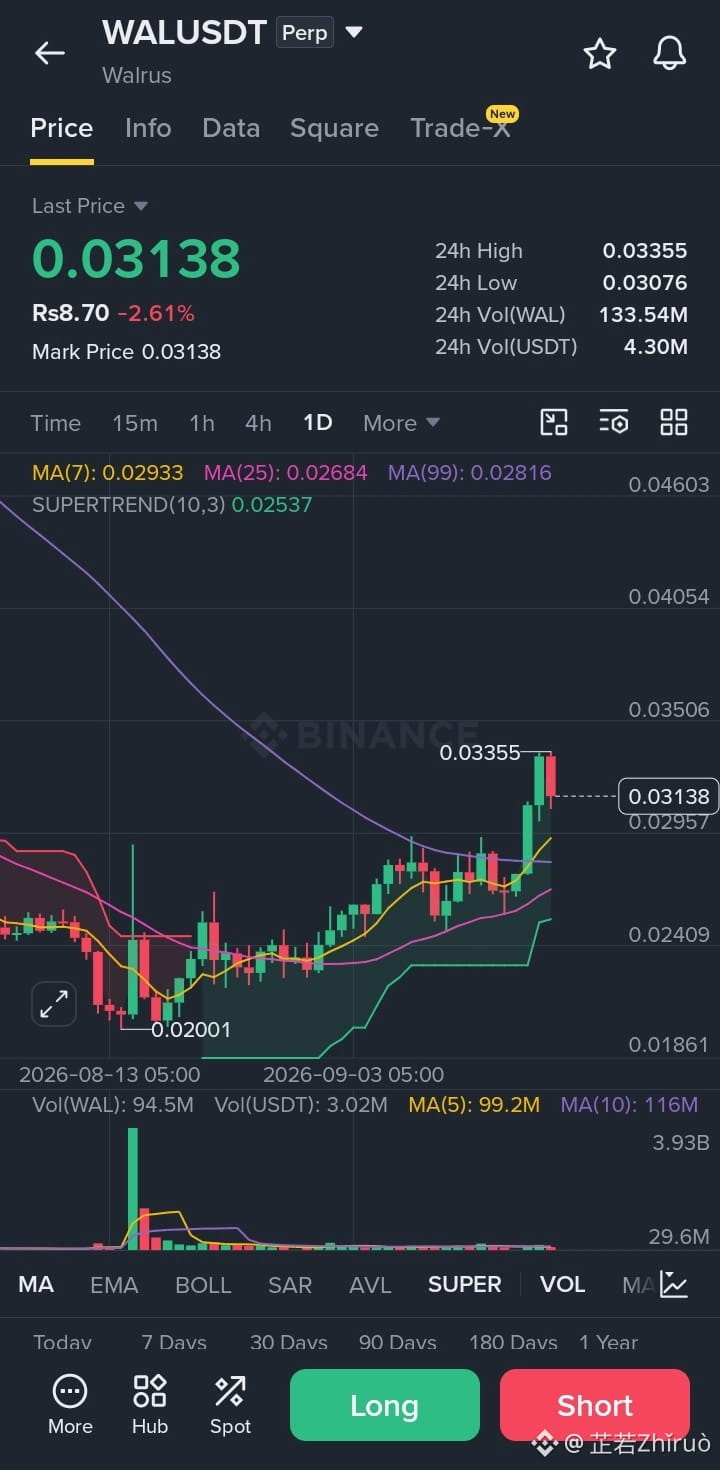
Based on the $WAL
USDT (Walrus) 1-Day chart:
Current Price & Moving Averages
* Last / Mark Price: 0.03138 USDT
* MA(7) [Yellow]: 0.02933 USDT
* MA(25) [Pink]: 0.02684 USDT
* MA(99) [Purple]: 0.02816 USDT
Price action has staged a strong breakout, holding above all major moving averages (MA7, MA25, and MA99), which confirms strong short-to-medium-term bullish momentum.
Technical Indicators & Key Levels
* Supertrend (10, 3): Positioned at 0.02537 (Green line). Since the indicator line sits well below the current price, the Supertrend reflects an active bullish signal on the daily timeframe.
* Immediate Resistance Levels & Targets:
* 0.03355 (24h High and recent breakout peak)
* 0.03506 (Next overhead price level)
* 0.04054 – 0.04603 (Higher swing targets from early chart history)
* Immediate Support Levels:
* 0.02933 (MA7 dynamic support)
* 0.02816 (MA99 structural support)
* 0.02684 (MA25 key support level)
* 0.02537 (Supertrend key trend support)
* 0.02001 (Major bottom swing low)
Trend Assessment
* Market Structure: Following a prolonged decline, WALUSDT established a local bottom around 0.02001 and initiated a series of higher highs and higher lows, culminating in a violent breakout above the 99-day moving average.
* Key Level to Watch: The recent peak at 0.03355 is the immediate barrier. A daily close above this level opens a path toward 0.03506 and higher extension levels.
* Outlook:
* Bullish Scenario: Retaining support above 0.02933 (MA7) keeps the momentum intact for another push to test 0.03355+.
* Pullback Scenario: If a short-term cooling occurs, key defensive support lies in the 0.02816–0.02933 band (MA99 and MA7).#VietnamPlansFirstCryptoLicensesIn2026 #SOLJumpsAbout10%
USDT (Walrus) 1-Day chart:
Current Price & Moving Averages
* Last / Mark Price: 0.03138 USDT
* MA(7) [Yellow]: 0.02933 USDT
* MA(25) [Pink]: 0.02684 USDT
* MA(99) [Purple]: 0.02816 USDT
Price action has staged a strong breakout, holding above all major moving averages (MA7, MA25, and MA99), which confirms strong short-to-medium-term bullish momentum.
Technical Indicators & Key Levels
* Supertrend (10, 3): Positioned at 0.02537 (Green line). Since the indicator line sits well below the current price, the Supertrend reflects an active bullish signal on the daily timeframe.
* Immediate Resistance Levels & Targets:
* 0.03355 (24h High and recent breakout peak)
* 0.03506 (Next overhead price level)
* 0.04054 – 0.04603 (Higher swing targets from early chart history)
* Immediate Support Levels:
* 0.02933 (MA7 dynamic support)
* 0.02816 (MA99 structural support)
* 0.02684 (MA25 key support level)
* 0.02537 (Supertrend key trend support)
* 0.02001 (Major bottom swing low)
Trend Assessment
* Market Structure: Following a prolonged decline, WALUSDT established a local bottom around 0.02001 and initiated a series of higher highs and higher lows, culminating in a violent breakout above the 99-day moving average.
* Key Level to Watch: The recent peak at 0.03355 is the immediate barrier. A daily close above this level opens a path toward 0.03506 and higher extension levels.
* Outlook:
* Bullish Scenario: Retaining support above 0.02933 (MA7) keeps the momentum intact for another push to test 0.03355+.
* Pullback Scenario: If a short-term cooling occurs, key defensive support lies in the 0.02816–0.02933 band (MA99 and MA7).#VietnamPlansFirstCryptoLicensesIn2026 #SOLJumpsAbout10%