📊 $BTC /USD — Technical Analysis
Market Structure:
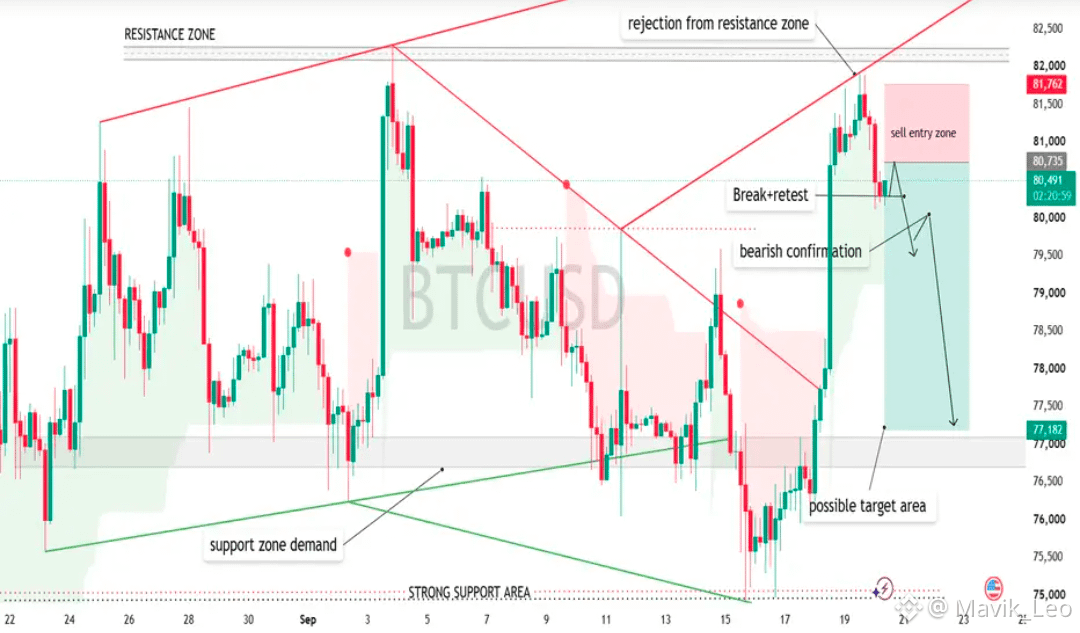
BTC has rallied strongly from the 75,000–76,000 demand/support area and reached the 81,800–82,200 resistance zone. Price is now showing a clear rejection from this major resistance.
🔴 Bearish Scenario
Resistance: 81,800–82,200
Price has rejected the resistance zone and is pulling back.
A break + retest below ~80,700–80,500 would strengthen the bearish setup.
Potential targets: 79,500 → 78,000 → 77,182 support zone
Deeper downside could revisit the 75,000 strong support if 77,182 fails.
🟢 Invalidation
A strong candle close above 82,200 would weaken the bearish idea and indicate a possible continuation toward higher levels.
Key idea: 🔻 Resistance rejection + bearish confirmation + break/retest = downside setup.
This is technical analysis, not financial advice.$ZAMA $AR
Market Structure:
BTC has rallied strongly from the 75,000–76,000 demand/support area and reached the 81,800–82,200 resistance zone. Price is now showing a clear rejection from this major resistance.
🔴 Bearish Scenario
Resistance: 81,800–82,200
Price has rejected the resistance zone and is pulling back.
A break + retest below ~80,700–80,500 would strengthen the bearish setup.
Potential targets: 79,500 → 78,000 → 77,182 support zone
Deeper downside could revisit the 75,000 strong support if 77,182 fails.
🟢 Invalidation
A strong candle close above 82,200 would weaken the bearish idea and indicate a possible continuation toward higher levels.
Key idea: 🔻 Resistance rejection + bearish confirmation + break/retest = downside setup.
This is technical analysis, not financial advice.$ZAMA $AR