What if the dip everyone’s afraid of is actually the chart reloading for its next leg up?
$ZEC just fell 7.7% in a day, but look closer — price is sitting right inside a bullish gap from the daily chart, around 1385 to 1422, where buyers previously stepped in with force.
The funding rate is barely positive, and the long/short ratio is deeply under 1 — most futures traders are positioned short. When everyone leans one way, the market often needs to take the other side.
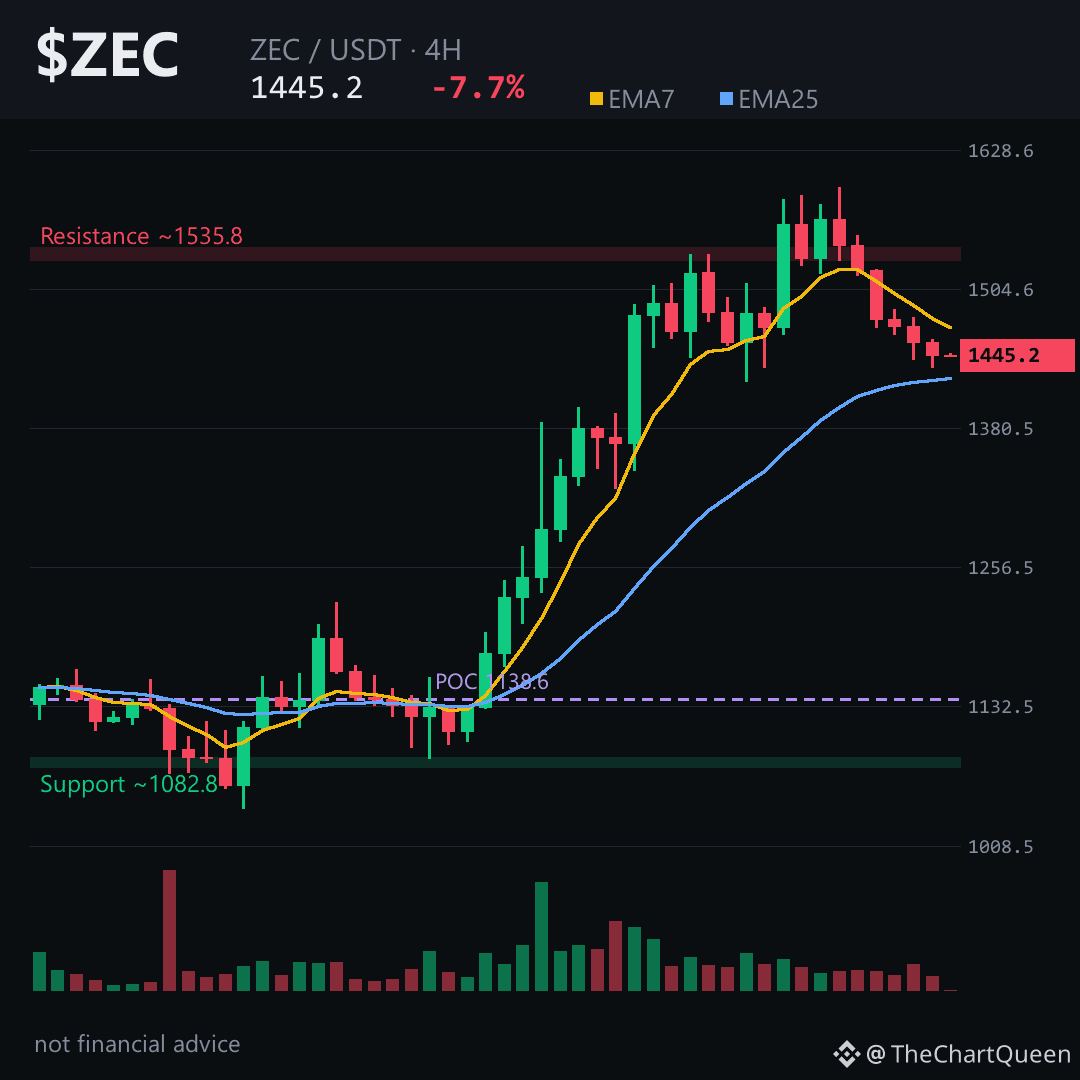
On the 4-hour chart, the short-term moving average is still above the longer one, even after this pullback. That’s the structure of an uptrend catching its breath, not breaking down.
The level that matters most: the ~1366 area. If $ZEC loses that zone on a 4-hour close, the bullish case gets shaky and lower prices become likely. But as long as price holds above it, the path toward the 1565 area stays open — that’s where the last rally stalled.
My read: a healthy cool-off inside a bigger uptrend, with shorts piling in at exactly the wrong time. Tap $ZEC to see how price reacts around that 1366 zone — that’s the line in the sand.
Follow me for the follow-up if this level breaks or bounces — I’ll map the next move in plain English.
How are you reading this pullback on ZEC? 👇
⚠️ Not financial advice. DYOR.
#ZEC #Zcash #Crypto #BinanceSquare
$ZEC just fell 7.7% in a day, but look closer — price is sitting right inside a bullish gap from the daily chart, around 1385 to 1422, where buyers previously stepped in with force.
The funding rate is barely positive, and the long/short ratio is deeply under 1 — most futures traders are positioned short. When everyone leans one way, the market often needs to take the other side.
On the 4-hour chart, the short-term moving average is still above the longer one, even after this pullback. That’s the structure of an uptrend catching its breath, not breaking down.
The level that matters most: the ~1366 area. If $ZEC loses that zone on a 4-hour close, the bullish case gets shaky and lower prices become likely. But as long as price holds above it, the path toward the 1565 area stays open — that’s where the last rally stalled.
My read: a healthy cool-off inside a bigger uptrend, with shorts piling in at exactly the wrong time. Tap $ZEC to see how price reacts around that 1366 zone — that’s the line in the sand.
Follow me for the follow-up if this level breaks or bounces — I’ll map the next move in plain English.
How are you reading this pullback on ZEC? 👇
⚠️ Not financial advice. DYOR.
#ZEC #Zcash #Crypto #BinanceSquare