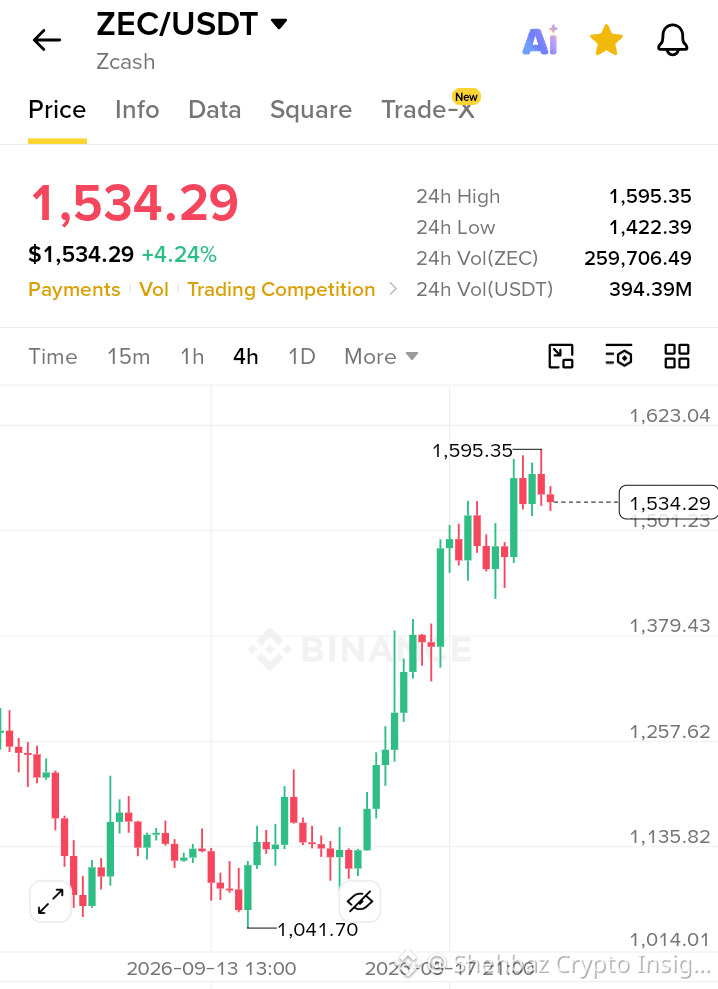
🚨 ZCASH (ZEC) SHORT-TERM TECHNICAL ANALYSIS 📊🔥
ZEC is trading at $1,533.63, with 24-hour trading volume of approximately $659M and a circulating market cap of about $25.9B.
📈 Price Performance
Over the past month, ZEC has delivered exceptional returns:
🔹 7-Day: +36.5%
🔹 30-Day: +169.6%
🚀 Recent Price Action
ZEC began the period around $551–$565 on August 20. A strong rally quickly developed, reaching $792 by August 22 and an intraday high of $853.
After peaking near $883 on August 23, ZEC consolidated in the $767–$856 range through late August.
The most significant move occurred during the last week:
🔹 Sep 16: Broke above $1,200, closing at $1,335
🔹 Sep 17: Reached $1,475, with an intraday high of $1,504
🔹 Sep 18: Reached an intraday high of $1,581, closing at $1,560
🔹 Sep 19: Opened at $1,560, hit $1,583, and is currently around $1,548
🎯 Key Technical Levels
🟢 Support
$1,440–$1,450 — Immediate support
$1,330–$1,360 — Potential support on deeper pullbacks
$1,100–$1,150 — Mid-September consolidation area
🔴 Resistance
$1,580–$1,583 — Immediate resistance
$1,500–$1,527 — Psychological level to watch
📊 Volume Analysis
Trading volume has been robust throughout the rally.
Volume reached $1.65B on August 22, followed by $872M on September 16 and $783M on September 17.
The latest 24-hour volume stands at $659M, indicating continued strong participation.
🔥 Technical Outlook
ZEC is in a clear short-term uptrend, having more than doubled in value over the past 30 days.
The recent price action shows a series of higher highs and higher lows, with the most recent breakout occurring from the $1,100–$1,150 range to current levels above $1,500.
The immediate focus is whether ZEC can sustain momentum above the $1,500 psychological level.
🚀 A break above $1,583 would signal continued bullish momentum.
⚠️ A failure to hold $1,440 could trigger a pullback toward the $1,330–$1,360 support zone.
$ZEC
ZEC is trading at $1,533.63, with 24-hour trading volume of approximately $659M and a circulating market cap of about $25.9B.
📈 Price Performance
Over the past month, ZEC has delivered exceptional returns:
🔹 7-Day: +36.5%
🔹 30-Day: +169.6%
🚀 Recent Price Action
ZEC began the period around $551–$565 on August 20. A strong rally quickly developed, reaching $792 by August 22 and an intraday high of $853.
After peaking near $883 on August 23, ZEC consolidated in the $767–$856 range through late August.
The most significant move occurred during the last week:
🔹 Sep 16: Broke above $1,200, closing at $1,335
🔹 Sep 17: Reached $1,475, with an intraday high of $1,504
🔹 Sep 18: Reached an intraday high of $1,581, closing at $1,560
🔹 Sep 19: Opened at $1,560, hit $1,583, and is currently around $1,548
🎯 Key Technical Levels
🟢 Support
$1,440–$1,450 — Immediate support
$1,330–$1,360 — Potential support on deeper pullbacks
$1,100–$1,150 — Mid-September consolidation area
🔴 Resistance
$1,580–$1,583 — Immediate resistance
$1,500–$1,527 — Psychological level to watch
📊 Volume Analysis
Trading volume has been robust throughout the rally.
Volume reached $1.65B on August 22, followed by $872M on September 16 and $783M on September 17.
The latest 24-hour volume stands at $659M, indicating continued strong participation.
🔥 Technical Outlook
ZEC is in a clear short-term uptrend, having more than doubled in value over the past 30 days.
The recent price action shows a series of higher highs and higher lows, with the most recent breakout occurring from the $1,100–$1,150 range to current levels above $1,500.
The immediate focus is whether ZEC can sustain momentum above the $1,500 psychological level.
🚀 A break above $1,583 would signal continued bullish momentum.
⚠️ A failure to hold $1,440 could trigger a pullback toward the $1,330–$1,360 support zone.
$ZEC