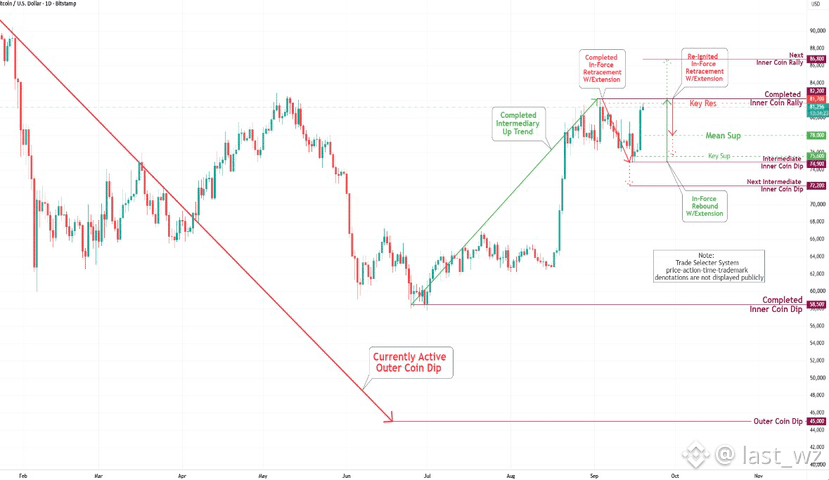
Bitcoin(BTC/USD) Daily Chart Analysis For Week of Sep 18, 2026.
Technical Analysis and Outlook:
Bitcoin encountered a powerful upward movement in last week's trading session,
successtully retesting the Key Resistance level at $81,700.
Following this, the next target price is the completed Inner Coin Rally at $82,200, with an eye on the major advancement to the next Inner Coin Rally at $86,800.
On the downside, the current trading price indicates a likely reignition of the In-Force Retracement to the Mean Support at $78,000, from the Key Resistance level at $81,700, or from the completed Inner Coin Rally at $82,200, and/or from the next Inner Coin Rally at $86,800 once reached.
However, once the price cascade is in place, this could open the possibility of reaching the Key Support level at $75,600, with the potential to extend and retest the completed Inner Coin Dip level at $74,900. $BTC #HKCompletesFirstHKDStablecoinUseCase #BTCBreaks80K
Technical Analysis and Outlook:
Bitcoin encountered a powerful upward movement in last week's trading session,
successtully retesting the Key Resistance level at $81,700.
Following this, the next target price is the completed Inner Coin Rally at $82,200, with an eye on the major advancement to the next Inner Coin Rally at $86,800.
On the downside, the current trading price indicates a likely reignition of the In-Force Retracement to the Mean Support at $78,000, from the Key Resistance level at $81,700, or from the completed Inner Coin Rally at $82,200, and/or from the next Inner Coin Rally at $86,800 once reached.
However, once the price cascade is in place, this could open the possibility of reaching the Key Support level at $75,600, with the potential to extend and retest the completed Inner Coin Dip level at $74,900. $BTC #HKCompletesFirstHKDStablecoinUseCase #BTCBreaks80K