$AR
Arweave (AR) Technical & Fundamental Analysis
1. Key Market Overview
Current Price: ~$2.55 – $3.50 range (subject to immediate market volatility)
Market Capitalization: ~$184M – $235M
Circulating / Max Supply: ~65.7M / 66.0M AR (Nearly fully diluted, low inflation risk)
All-Time High: $89.24 (Nov 2021)
2. Technical Analysis & Key Chart Levels
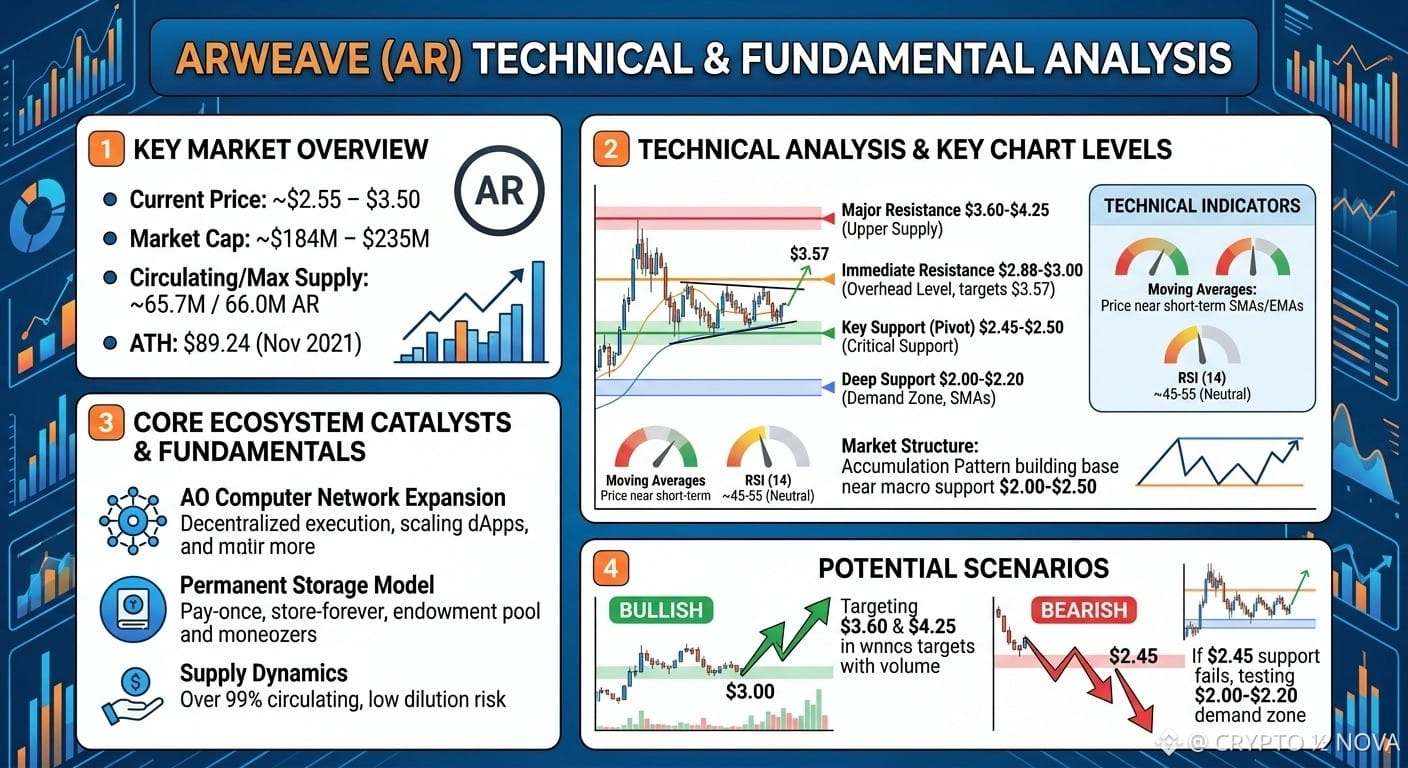
Level Resistance$2.88 – $3.00Key overhead level; breaking this targets the $3.57 zone.Major Resistance$3.60 – $4.25The upper supply zone capping multi-week breakout attempts.Key Support (Pivot)$2.45 – $2.50Critical horizontal support holding the current consolidation structure.Deep Support$2.00 – $2.20Demand zone backed by long-term moving averages (50-day & 100-day SMAs).
Technical Indicators
Moving Averages: Price is oscillating near short-term SMAs/EMAs. A sustained daily close above the 50-day SMA ($2.05–$2.20) keeps the structural recovery intact.
RSI (14): ~45–55 (Neutral), indicating range-bound consolidation between support and resistance levels.
Market Structure: Accumulation pattern following past downside expansion. Price is building a base near major macro support around $2.00–$2.50.
3. Core Ecosystem Catalysts & Fundamentals
AO Computer Network Expansion: hyper-parallel computer protocol (AO) extends its utility beyond decentralized data storage into decentralized execution, scaling dApp capabilities.
Permanent Storage Model: Unlike rental-based storage solutions relies on a pay-once, store-forever model backed by proof-of-access consensus and an endowment pool.
Supply Dynamics: Over 99% of maximum token supply is in circulation, mitigating significant venture capital unlock/dilution pressures.
4. Potential Scenarios
Bullish Scenario: A confirmed daily candle close above $3.00 with surging volume opens a path toward $3.60 and $4.25.
Bearish Scenario: Losing the $2.45 pivot support invalidates the short-term structure, triggering a test of lower support in the $2.00–$2.20 demand zone.n #BTCBreaks80K #LineraShutsDownAfterFundraisingFallsShort
Arweave (AR) Technical & Fundamental Analysis
1. Key Market Overview
Current Price: ~$2.55 – $3.50 range (subject to immediate market volatility)
Market Capitalization: ~$184M – $235M
Circulating / Max Supply: ~65.7M / 66.0M AR (Nearly fully diluted, low inflation risk)
All-Time High: $89.24 (Nov 2021)
2. Technical Analysis & Key Chart Levels
Level Resistance$2.88 – $3.00Key overhead level; breaking this targets the $3.57 zone.Major Resistance$3.60 – $4.25The upper supply zone capping multi-week breakout attempts.Key Support (Pivot)$2.45 – $2.50Critical horizontal support holding the current consolidation structure.Deep Support$2.00 – $2.20Demand zone backed by long-term moving averages (50-day & 100-day SMAs).
Technical Indicators
Moving Averages: Price is oscillating near short-term SMAs/EMAs. A sustained daily close above the 50-day SMA ($2.05–$2.20) keeps the structural recovery intact.
RSI (14): ~45–55 (Neutral), indicating range-bound consolidation between support and resistance levels.
Market Structure: Accumulation pattern following past downside expansion. Price is building a base near major macro support around $2.00–$2.50.
3. Core Ecosystem Catalysts & Fundamentals
AO Computer Network Expansion: hyper-parallel computer protocol (AO) extends its utility beyond decentralized data storage into decentralized execution, scaling dApp capabilities.
Permanent Storage Model: Unlike rental-based storage solutions relies on a pay-once, store-forever model backed by proof-of-access consensus and an endowment pool.
Supply Dynamics: Over 99% of maximum token supply is in circulation, mitigating significant venture capital unlock/dilution pressures.
4. Potential Scenarios
Bullish Scenario: A confirmed daily candle close above $3.00 with surging volume opens a path toward $3.60 and $4.25.
Bearish Scenario: Losing the $2.45 pivot support invalidates the short-term structure, triggering a test of lower support in the $2.00–$2.20 demand zone.n #BTCBreaks80K #LineraShutsDownAfterFundraisingFallsShort