


 #BNB_Market_Update
BNB has remained one of the most closely watched large-cap crypto assets this week, with traders focusing on whether recent momentum can hold as broader market sentiment shifts.
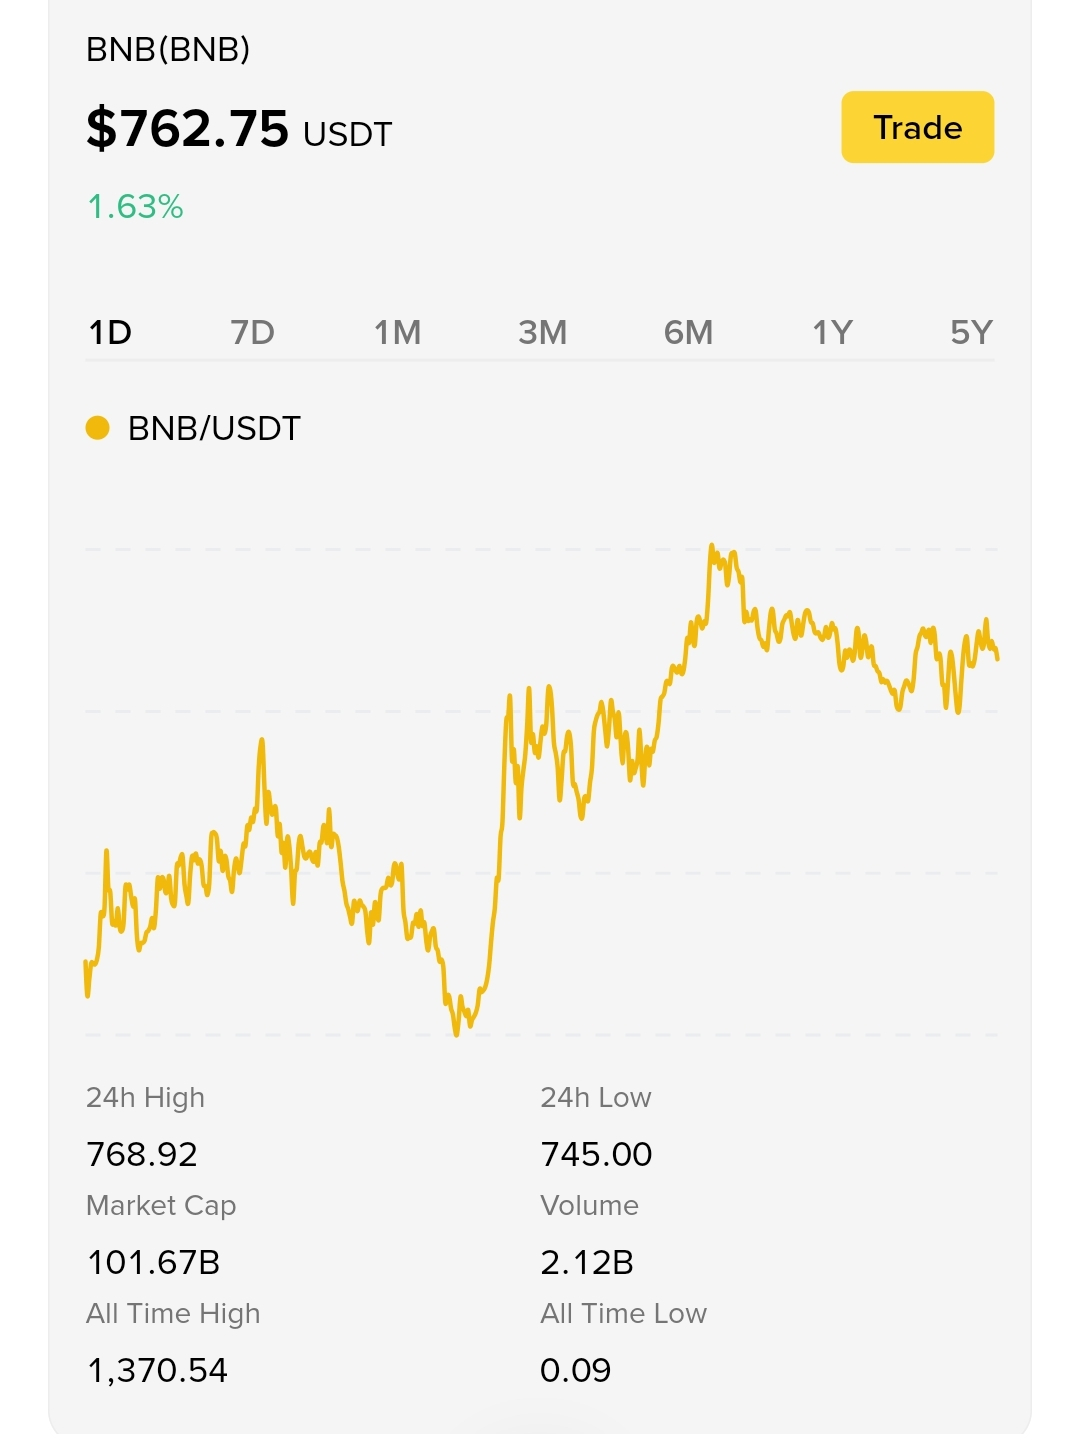
Over the past seven days, BNB’s price action has reflected a familiar crypto-market pattern: sharp intraday moves, quick reactions to market-wide volatility, and strong attention around key psychological price zones. The 7-day chart is useful because it filters out some of the noise of minute-by-minute moves while still showing whether buyers or sellers have had more control during the week.
A Week of Volatility, Not a Straight Line
BNB’s recent movement has not been a one-way trend. Instead, the chart shows alternating periods of rallies, pullbacks, and consolidation. This kind of structure often appears when market participants are reassessing risk after a large move.
For traders, the important question is not only whether BNB is up or down over seven days. It is also whether price is making a sequence of higher highs and higher lows, or whether rallies are being sold into. That distinction can reveal whether momentum is strengthening or fading.
Why BNB Still Draws Attention
BNB remains central to the Binance ecosystem, with use cases that include trading-fee discounts, participation across BNB Chain applications, and access to selected platform features. Because of this, its price can react not only to the overall crypto market but also to ecosystem developments, token utility demand, and changes in activity across BNB Chain.
That does not make BNB immune to market risk. Like other major digital assets, it can move quickly when Bitcoin, Ethereum, macroeconomic news, liquidity conditions, or investor sentiment change.
What to Watch on the 7-Day Chart
When reviewing BNB’s chart, a few signals are worth tracking:
Volume: Rising volume during rallies may indicate stronger participation, while low-volume moves can be less convincing.
Daily closes: A price move that holds into the daily close can carry more weight than a short-lived intraday spike.
Market correlation: BNB often trades alongside broader crypto sentiment, so BTC and ETH movement can influence its direction.
Volatility range: A widening range can signal increased uncertainty, while tightening movement may precede a larger breakout in either direction.
Bottom Line
BNB’s 7-day chart highlights an active and volatile market rather than a guaranteed directional trend. The asset continues to benefit from strong ecosystem relevance, but short-term price action remains sensitive to wider crypto conditions and sentiment.
As always, historical chart patterns do not guarantee future performance. Anyone assessing BNB should consider their time horizon, risk tolerance, and the possibility of rapid price swings before making any trading decision.#Binnacesqaure #viralpost $BNB