
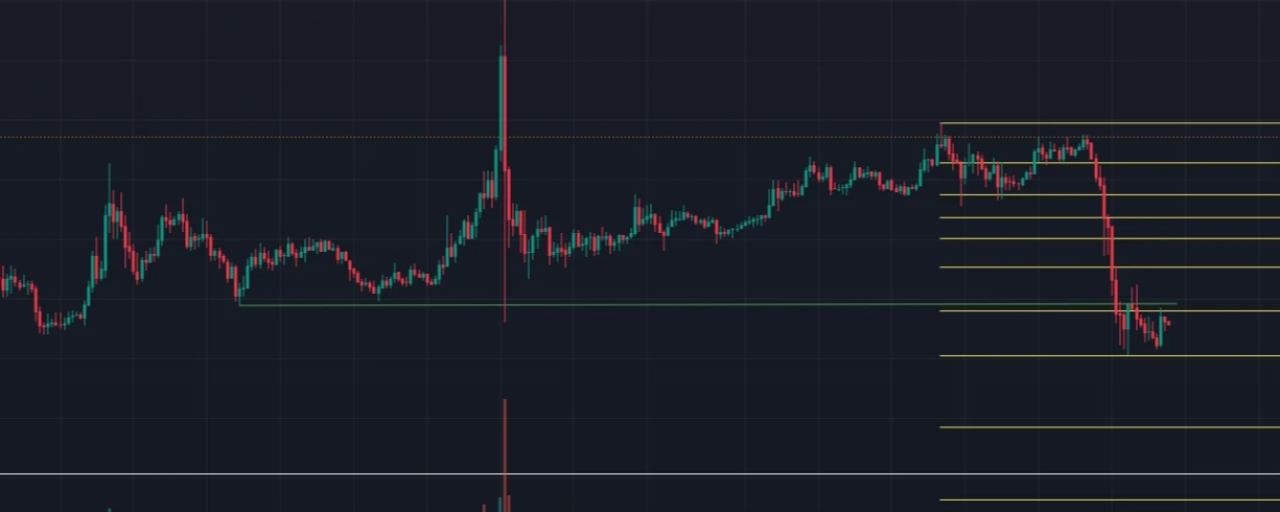

PI has lost more than 15% since September 15 and the chart is starting to show why the move is struggling to recover.
What caught my attention is not just the drop from $0.10 to around $0.083.
It is the fact that $0.10 has repeatedly rejected the price since July.
That level has become more than a psychological number. It is acting as a supply zone where buyers have not been able to create a convincing breakout.
The bigger structure also remains weak.
PI has been trading inside a much larger bearish swing structure between roughly $0.1395 and $0.07 since June 2025. So the recent decline is not happening in isolation. It is taking place inside an established downtrend.
The 4 hour chart adds another warning.
PI broke below the previous $0.0844 low which shifted the short term structure back toward sellers. That leaves the current area vulnerable if buyers cannot quickly reclaim it.
There is still room for a bounce.
The Fibonacci levels point toward roughly $0.0918 as an area where PI could recover before facing another serious test.
But this is where I would be careful with the word recovery.
A bounce toward $0.0918 does not automatically change the trend.
For me the first level that really matters is $0.0844. Reclaiming it would at least repair the broken short term structure.
Then comes $0.0918.
And above everything sits $0.0986 to $0.10.
Until PI can break that supply area and actually hold above it I would treat rallies as reactions inside the larger downtrend rather than a confirmed reversal.
The interesting part now is whether buyers defend the current area or sellers push PI toward the lower end of its larger range.
$0.07 remains the major downside reference from the higher timeframe structure.