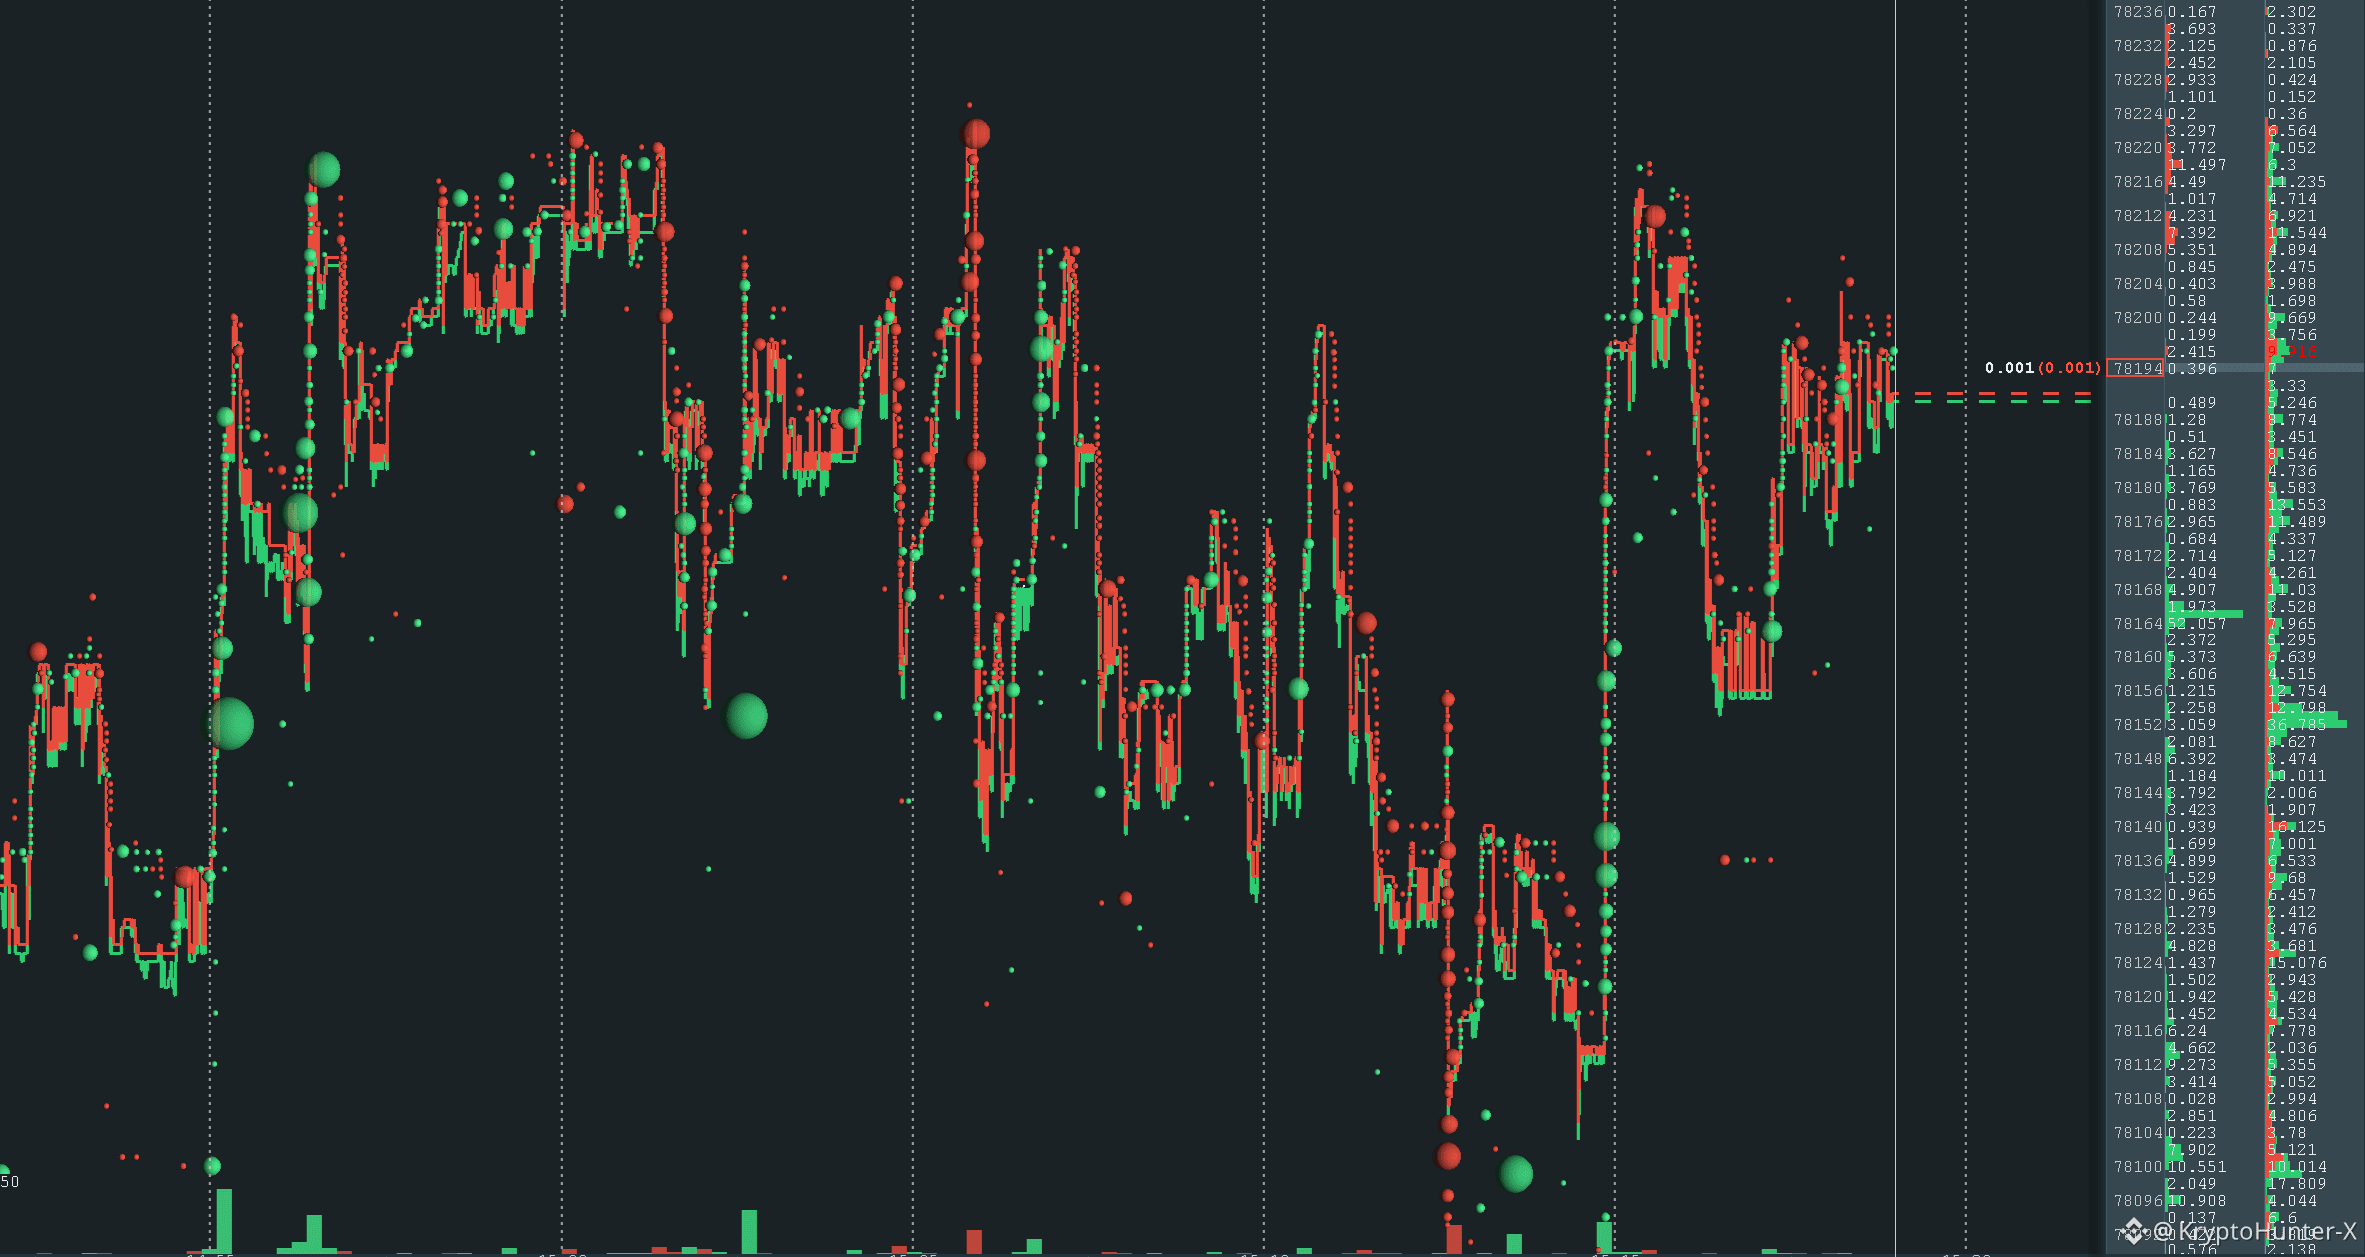
$BTC is trading around $78,190–$78,200 on the Bookmap screen. The chart shows a sharp recovery from approximately $78,100, but the latest price action remains choppy and trapped inside a short-term range.
Green buying activity is visible near $78,120–$78,160, suggesting support. However, repeated selling appears around $78,205–$78,225, creating immediate resistance. Until one side absorbs the opposite liquidity, the market may continue moving sideways.
Resistance: $78,205–$78,225 Breakout target: $78,250–$78,300 Support: $78,150 Major support: $78,100–$78,120
My bias is neutral to slightly bullish, as long as BTC holds above $78,150.
A clean move above $78,225 with strong buying may lead toward $78,250–$78,300. Failure to break resistance, followed by a loss of $78,150, could send price back toward $78,100–$78,120. At the current level, the market looks range-bound, so chasing a trade is risky.
Best approach: Wait for a confirmed breakout or a clear rejection. The screenshot does not show a high confidence entry yet. Always use a defined stop-loss because order-flow conditions can change quickly.
#BTC #CryptoAnalysis #CryptoTrading #Binance
Green buying activity is visible near $78,120–$78,160, suggesting support. However, repeated selling appears around $78,205–$78,225, creating immediate resistance. Until one side absorbs the opposite liquidity, the market may continue moving sideways.
Resistance: $78,205–$78,225 Breakout target: $78,250–$78,300 Support: $78,150 Major support: $78,100–$78,120
My bias is neutral to slightly bullish, as long as BTC holds above $78,150.
A clean move above $78,225 with strong buying may lead toward $78,250–$78,300. Failure to break resistance, followed by a loss of $78,150, could send price back toward $78,100–$78,120. At the current level, the market looks range-bound, so chasing a trade is risky.
Best approach: Wait for a confirmed breakout or a clear rejection. The screenshot does not show a high confidence entry yet. Always use a defined stop-loss because order-flow conditions can change quickly.
#BTC #CryptoAnalysis #CryptoTrading #Binance