
🚨 $STRK IS COILING UNDER RESISTANCE — $0.048 IS BACK ON MY RADAR 👀🔥
Stop… stop… stop… scrolling fam!
Give me 1 minute because STRK/USDT just made a powerful recovery from the $0.025–$0.027 demand zone, and now the chart is showing something I really like:
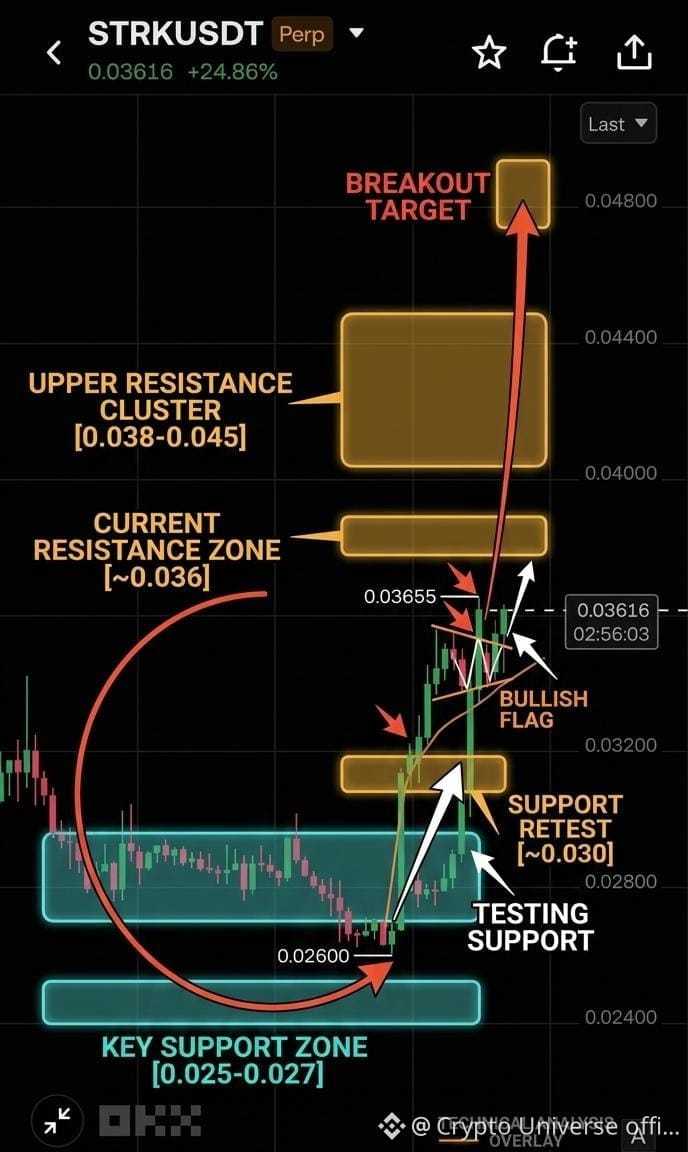
A bullish flag forming right under resistance. 📈
STRK pushed aggressively from around $0.026 and reached $0.03655 before pulling into a tight consolidation.
Right now, price is around $0.03616.
And this is the interesting part…
The sellers tried to reject the move near $0.0365, but instead of collapsing, STRK started building a flag.
That tells me the battle is happening right at the ceiling.
🔥 THE $0.036 BREAKOUT BATTLE
If STRK breaks above the $0.036–$0.0365 resistance area with strong momentum, the next liquidity zones on my chart are:
🎯 $0.038
🎯 $0.042
🎯 $0.045
🚀 $0.048
And if that upper resistance cluster finally gets cleared…
$0.048 becomes the bigger expansion target.
📍 MY STRK MAP
🟢 Entry zone: $0.0340–$0.0360
🔥 Breakout zone: $0.036–$0.0365
🎯 TP1: $0.038
🎯 TP2: $0.042
🎯 TP3: $0.045
🚀 TP4: $0.048
🛑 SL: $0.0315
The level I’m watching underneath everything is $0.030.
STRK already tested that area before forming this flag, and buyers stepped in.
So now we have a simple structure:
$0.030 = support
$0.036 = resistance
$0.038–$0.045 = liquidity zone
$0.048 = breakout target
STRK has already made the first move.
Now I’m watching to see whether this flag becomes the launchpad for the next one. 🚀
Who’s watching STRK with me — breakout above $0.0365 or one more shakeout first? 👀
Stop… stop… stop… scrolling fam!
Give me 1 minute because STRK/USDT just made a powerful recovery from the $0.025–$0.027 demand zone, and now the chart is showing something I really like:
A bullish flag forming right under resistance. 📈
STRK pushed aggressively from around $0.026 and reached $0.03655 before pulling into a tight consolidation.
Right now, price is around $0.03616.
And this is the interesting part…
The sellers tried to reject the move near $0.0365, but instead of collapsing, STRK started building a flag.
That tells me the battle is happening right at the ceiling.
🔥 THE $0.036 BREAKOUT BATTLE
If STRK breaks above the $0.036–$0.0365 resistance area with strong momentum, the next liquidity zones on my chart are:
🎯 $0.038
🎯 $0.042
🎯 $0.045
🚀 $0.048
And if that upper resistance cluster finally gets cleared…
$0.048 becomes the bigger expansion target.
📍 MY STRK MAP
🟢 Entry zone: $0.0340–$0.0360
🔥 Breakout zone: $0.036–$0.0365
🎯 TP1: $0.038
🎯 TP2: $0.042
🎯 TP3: $0.045
🚀 TP4: $0.048
🛑 SL: $0.0315
The level I’m watching underneath everything is $0.030.
STRK already tested that area before forming this flag, and buyers stepped in.
So now we have a simple structure:
$0.030 = support
$0.036 = resistance
$0.038–$0.045 = liquidity zone
$0.048 = breakout target
STRK has already made the first move.
Now I’m watching to see whether this flag becomes the launchpad for the next one. 🚀
Who’s watching STRK with me — breakout above $0.0365 or one more shakeout first? 👀