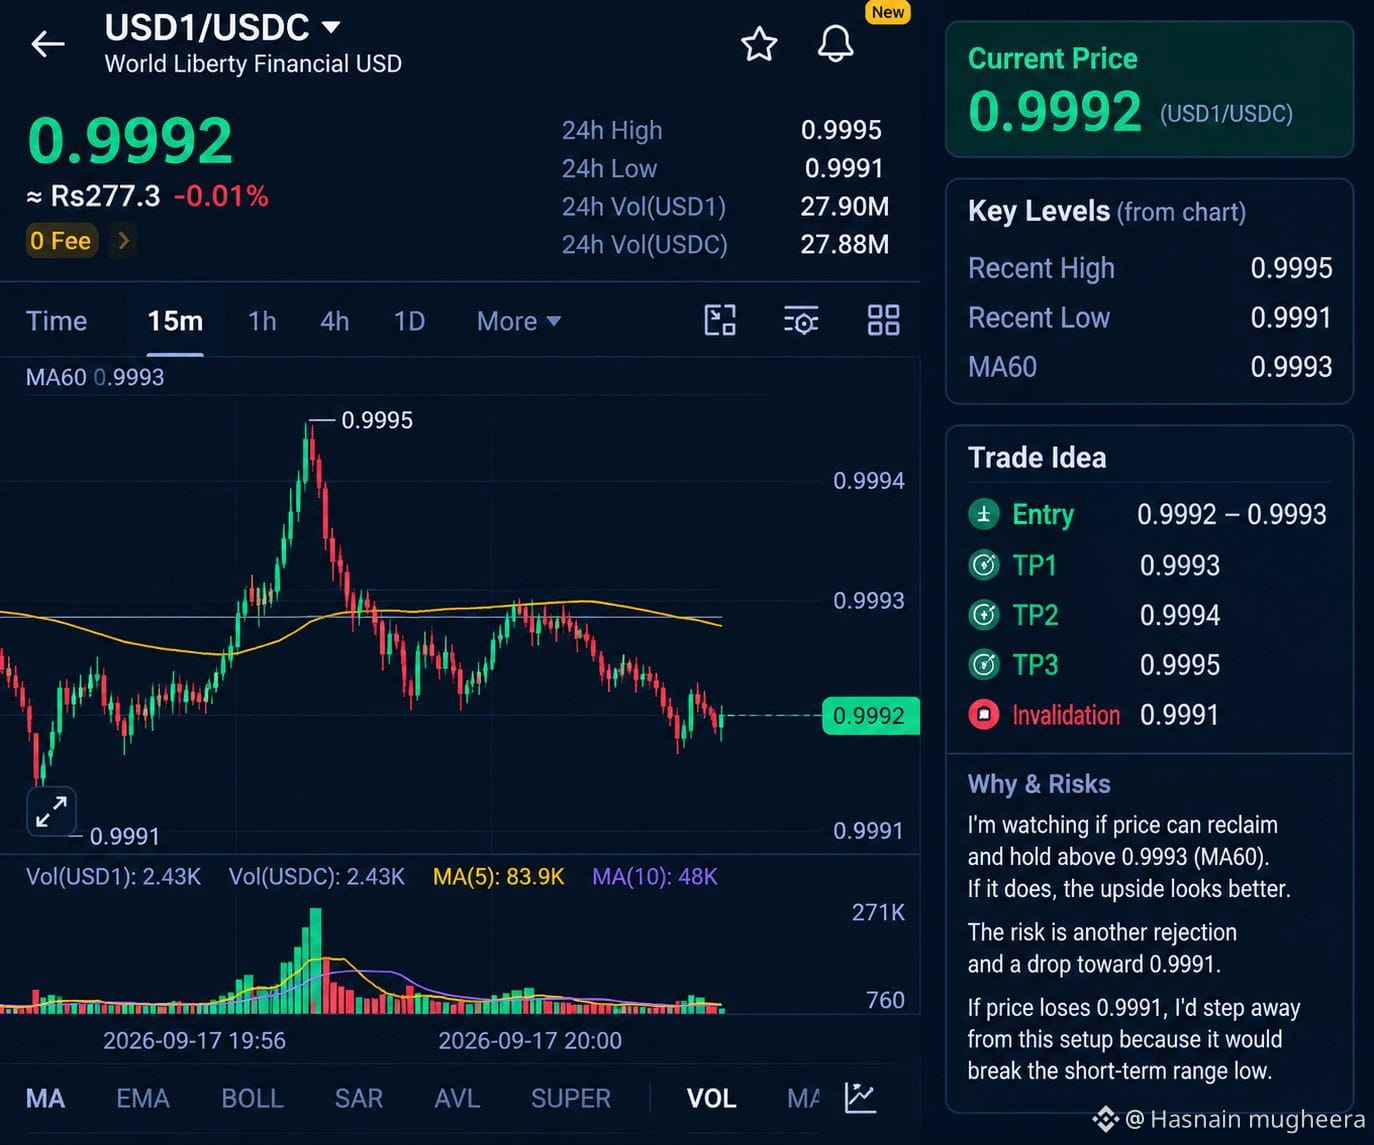
I’m looking at $USD1 /USDC around 0.9992, and the chart is extremely tight. Price briefly pushed up toward 0.99935, then rejected and returned to the 0.9992 area, so I’m treating this as a range rather than chasing the spike.
For me, the key zone is 0.9992–0.9993. The visible MA60 sits around 0.9993, while the recent chart low is around 0.9991. I’d want to see price reclaim and hold above 0.9993 before considering the upside setup attractive. The main risk is another rejection and return toward the lower range.
📍 Entry: 0.9992–0.9993
🎯 TP1: 0.9993
🎯 TP2: 0.9994
🎯 TP3: 0.9995
🛑 Invalidation: 0.9991
If price loses 0.9991, I’d step away from this setup because that would break the visible short-term range low.
The chart doesn’t show enough structure for a high-conviction directional trade, so I’d keep expectations modest. I’m mainly watching whether 0.9993 can turn into support instead of buying directly into another rejection.
For me, the key zone is 0.9992–0.9993. The visible MA60 sits around 0.9993, while the recent chart low is around 0.9991. I’d want to see price reclaim and hold above 0.9993 before considering the upside setup attractive. The main risk is another rejection and return toward the lower range.
📍 Entry: 0.9992–0.9993
🎯 TP1: 0.9993
🎯 TP2: 0.9994
🎯 TP3: 0.9995
🛑 Invalidation: 0.9991
If price loses 0.9991, I’d step away from this setup because that would break the visible short-term range low.
The chart doesn’t show enough structure for a high-conviction directional trade, so I’d keep expectations modest. I’m mainly watching whether 0.9993 can turn into support instead of buying directly into another rejection.