*ETH/USDT at $2,466 After Rejection at $2,483 – Holding MA60 Support*
Ethereum is cooling off after a strong intraday rally.
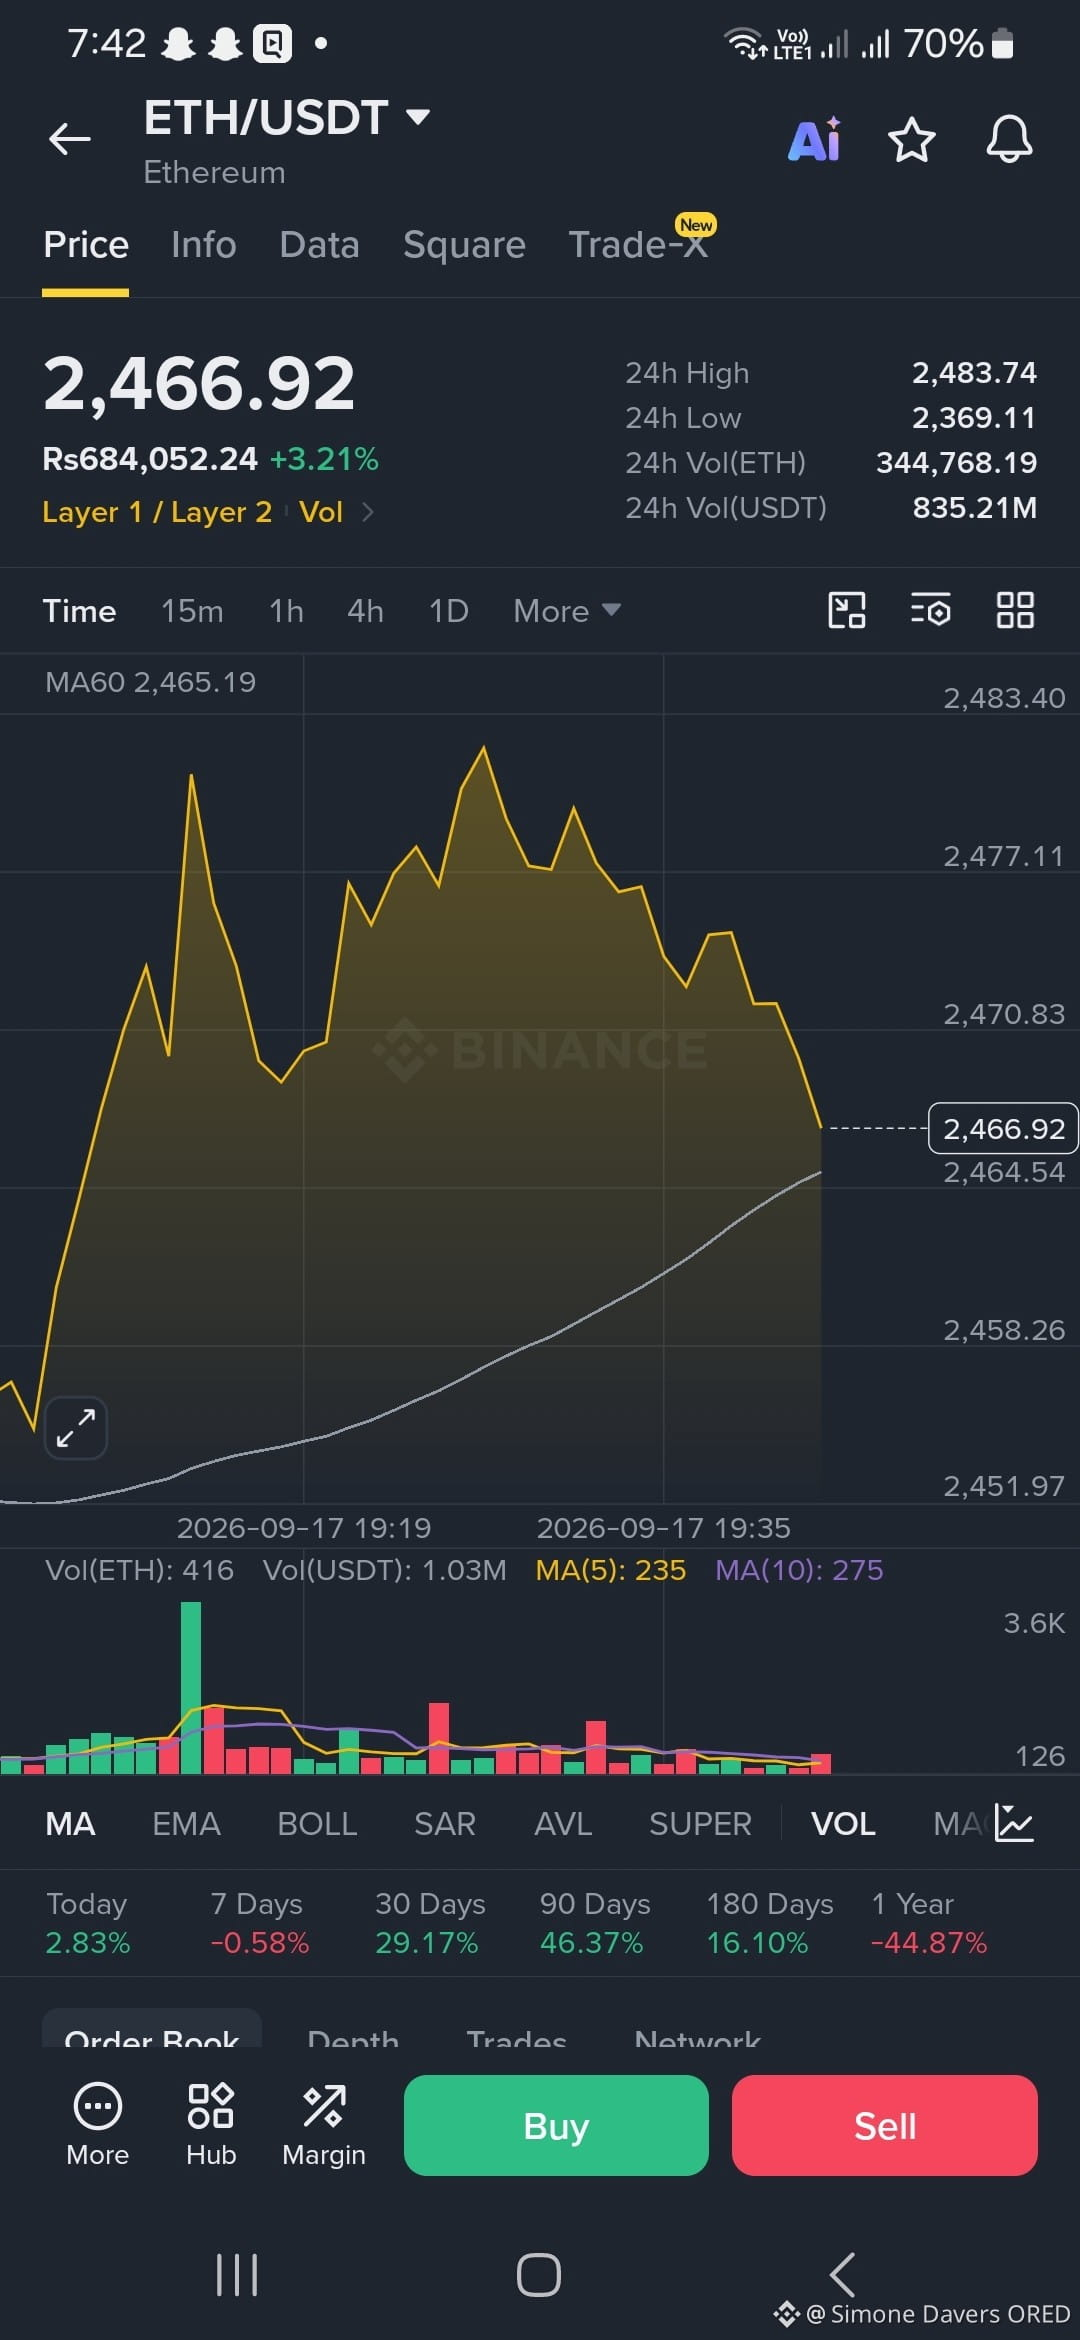
*ETH/USDT* is currently trading at *$2,466.92 (Rs 684,052.24)*, up *+3.21%* on the day. ETH hit a *24H High of $2,483.74* and a *24H Low of $2,369.11*, with 24H volume of *344,768.19 ETH / $835.21M USDT*.
*Technical Breakdown:*
*1. Double Top Rejection:*
The chart shows a clear double-top formation near $2,482-$2,483. ETH tried twice to break higher and failed, now pulling back. This is short-term bearish price action and shows sellers are active above $2,480.
*2. Critical Test – MA60:*
ETH is now testing *MA60 support at $2,465.19*. Price at $2,466.92 is holding just $1.7 above it. This is the key level for bulls. Holding above MA60 keeps the intraday uptrend intact, a break below could open a drop toward $2,458 and $2,451.
*3. Volume Drying Up:*
Vol(ETH): 416 vs MA(5): 235 and MA(10): 275. After the initial spike (big green volume bar on the left), buying volume has faded during the pullback. This suggests profit-taking, not panic selling – yet.
*4. Stronger Timeframe Context:*
Today: *+2.83%* | 7 Days: *-0.58%* | 30 Days: *+29.17%* | 90 Days: *+46.37%* | 180 Days: *+16.10%*
ETH remains in a solid medium-term uptrend despite being -44.87% down on the 1-year chart. The 7-day flat performance (-0.58%) shows this is consolidation, not a reversal.
*Key Levels:*
Resistance: $2,477 → $2,483.74 (must break for continuation)
Support: $2,465.19 (MA60) → $2,369.11
Bulls need to defend MA60 to target $2,500. Bears will look for a 15m close below $2,465 for a short toward $2,450.
What’s your bias – bounce from MA60 or deeper correction?
$ETH
#ETHUSDT #Ethereum #ETH #BinanceSquare #CryptoAnalysis
Ethereum is cooling off after a strong intraday rally.
*ETH/USDT* is currently trading at *$2,466.92 (Rs 684,052.24)*, up *+3.21%* on the day. ETH hit a *24H High of $2,483.74* and a *24H Low of $2,369.11*, with 24H volume of *344,768.19 ETH / $835.21M USDT*.
*Technical Breakdown:*
*1. Double Top Rejection:*
The chart shows a clear double-top formation near $2,482-$2,483. ETH tried twice to break higher and failed, now pulling back. This is short-term bearish price action and shows sellers are active above $2,480.
*2. Critical Test – MA60:*
ETH is now testing *MA60 support at $2,465.19*. Price at $2,466.92 is holding just $1.7 above it. This is the key level for bulls. Holding above MA60 keeps the intraday uptrend intact, a break below could open a drop toward $2,458 and $2,451.
*3. Volume Drying Up:*
Vol(ETH): 416 vs MA(5): 235 and MA(10): 275. After the initial spike (big green volume bar on the left), buying volume has faded during the pullback. This suggests profit-taking, not panic selling – yet.
*4. Stronger Timeframe Context:*
Today: *+2.83%* | 7 Days: *-0.58%* | 30 Days: *+29.17%* | 90 Days: *+46.37%* | 180 Days: *+16.10%*
ETH remains in a solid medium-term uptrend despite being -44.87% down on the 1-year chart. The 7-day flat performance (-0.58%) shows this is consolidation, not a reversal.
*Key Levels:*
Resistance: $2,477 → $2,483.74 (must break for continuation)
Support: $2,465.19 (MA60) → $2,369.11
Bulls need to defend MA60 to target $2,500. Bears will look for a 15m close below $2,465 for a short toward $2,450.
What’s your bias – bounce from MA60 or deeper correction?
$ETH
#ETHUSDT #Ethereum #ETH #BinanceSquare #CryptoAnalysis