$BR looks bullish, but this is not the kind of bullish chart I would subscribe to! - I'm leaning towards Short
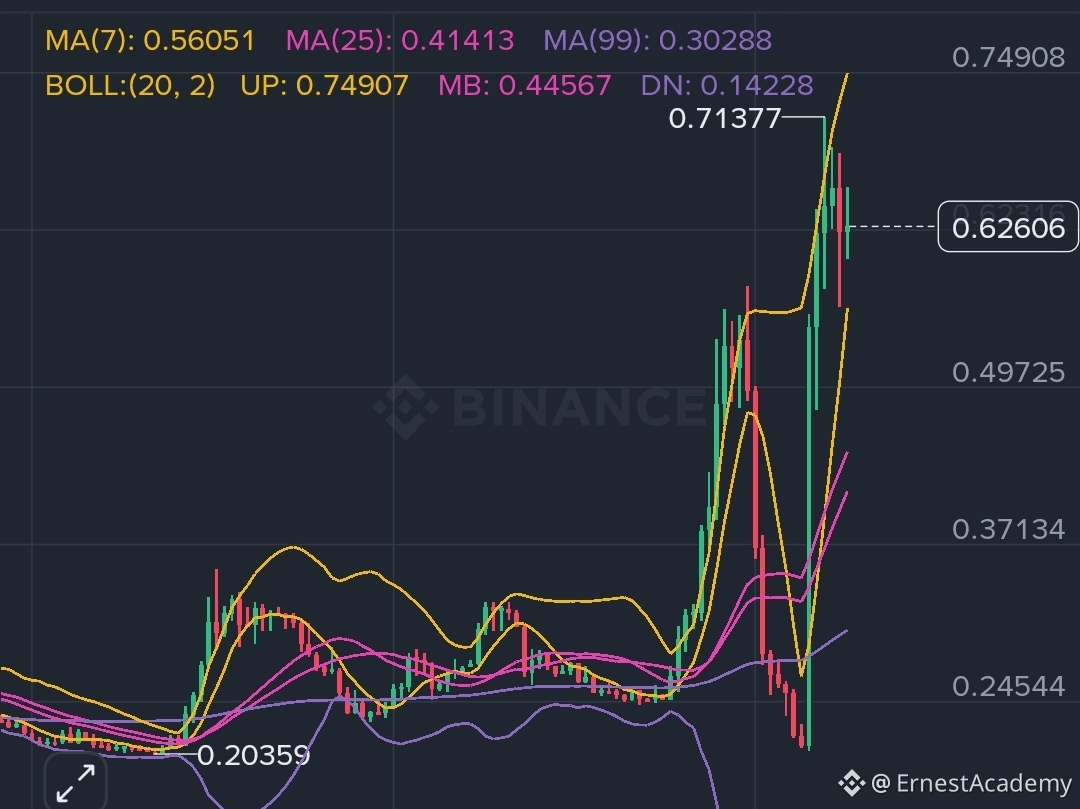
The last 24 hours have been wild. $BR moved from around $0.23 to $0.50, crashed back toward $0.20, then completely reversed and pushed into the $0.70 area before settling around $0.60. That kind of price action tells us one thing very clearly: volatility is extremely high.
And the interesting part is that despite that massive shakeout, buyers managed to push the token back toward the highs.
On the chart, the current consolidation around $0.60 is what I would be watching most closely. After such a violent move, consolidation can be healthy if buyers continue defending the area. But if the range starts breaking down, that would show that the earlier pump was losing its strength.
BR has also just printed a new all-time high around $0.7 on Binance, while 24-hour trading volume has surged significantly.
So my take:
$BR is bullish in structure, but extremely volatile.
The move from $0.20 to the $0.70 region happened very quickly. That makes the current $0.60 area much more important than simply chasing the latest green candles.
If BR can continue consolidating around these elevated levels, it would suggest buyers are absorbing the volatility rather than immediately giving back the entire move. Let's see whether #BR can hold the gains after everything that happened in the last 24 hours.
The last 24 hours have been wild. $BR moved from around $0.23 to $0.50, crashed back toward $0.20, then completely reversed and pushed into the $0.70 area before settling around $0.60. That kind of price action tells us one thing very clearly: volatility is extremely high.
And the interesting part is that despite that massive shakeout, buyers managed to push the token back toward the highs.
On the chart, the current consolidation around $0.60 is what I would be watching most closely. After such a violent move, consolidation can be healthy if buyers continue defending the area. But if the range starts breaking down, that would show that the earlier pump was losing its strength.
BR has also just printed a new all-time high around $0.7 on Binance, while 24-hour trading volume has surged significantly.
So my take:
$BR is bullish in structure, but extremely volatile.
The move from $0.20 to the $0.70 region happened very quickly. That makes the current $0.60 area much more important than simply chasing the latest green candles.
If BR can continue consolidating around these elevated levels, it would suggest buyers are absorbing the volatility rather than immediately giving back the entire move. Let's see whether #BR can hold the gains after everything that happened in the last 24 hours.