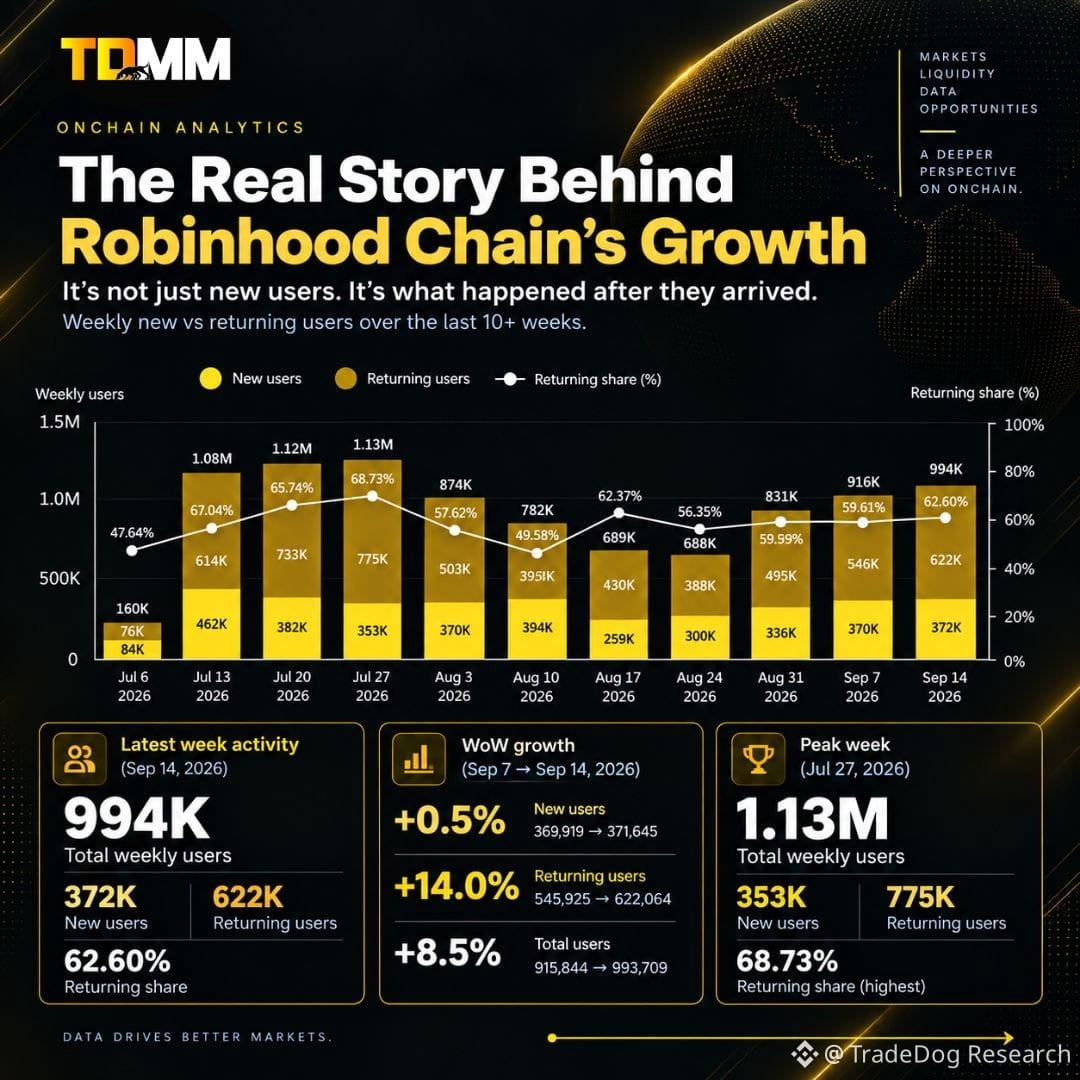
The Real Story Behind Robinhood Chain's Growth 👀
New users are usually the headline metric.
But what happens after they arrive may be just as important.
We analyzed more than 10 weeks of weekly activity on Robinhood Chain and separated new users from returning users.
Here's what stood out.
New users have been volatile
New-user activity surged in mid-July:
84K → 462K
Then normalized through August before recovering into September.
By Sep 14:
371,645 new users
But returning activity tells a different story.
Returning users are becoming a bigger part of weekly activity
Returning users reached:
614K on Jul 13
733K on Jul 20
775K on Jul 27
After declining through August, they recovered to:
622,064 on Sep 14
And the latest week shows the clearest divergence.
Sep 7 → Sep 14
👤 New users
369,919 → 371,645
+0.5%
🔁 Returning users
545,925 → 622,064
+14.0%
📊 Total weekly activity
915,844 → 993,709
The latest increase in weekly activity therefore came disproportionately from returning users.
Returning share also tells an interesting story
Returning users accounted for:
47.64% of activity on Jul 6
57.04% on Jul 13
68.73% on Jul 27
62.60% on Sep 14
That means the composition of weekly activity has shifted considerably since early July.
But there's an important distinction:
Returning activity ≠ retention
These are aggregate weekly activity figures.
They do not represent individual user cohorts, so they should not be interpreted as D7 or D30 retention.
Instead, they tell us how much weekly activity is coming from users who had already been active.
The bigger takeaway
New users tell us who showed up.
Returning users tell us who came back.
Both are important.
But they answer different questions.
For Robinhood Chain, the next metric worth watching may be the relationship between:
New-user momentum × returning-user activity
Because onchain growth isn't only about getting more wallets through the door.
It's also about what happens after they enter.
$HOOD
#Crypto #RobinhoodChain #Onchain #Blockchain #Web3
New users are usually the headline metric.
But what happens after they arrive may be just as important.
We analyzed more than 10 weeks of weekly activity on Robinhood Chain and separated new users from returning users.
Here's what stood out.
New users have been volatile
New-user activity surged in mid-July:
84K → 462K
Then normalized through August before recovering into September.
By Sep 14:
371,645 new users
But returning activity tells a different story.
Returning users are becoming a bigger part of weekly activity
Returning users reached:
614K on Jul 13
733K on Jul 20
775K on Jul 27
After declining through August, they recovered to:
622,064 on Sep 14
And the latest week shows the clearest divergence.
Sep 7 → Sep 14
👤 New users
369,919 → 371,645
+0.5%
🔁 Returning users
545,925 → 622,064
+14.0%
📊 Total weekly activity
915,844 → 993,709
The latest increase in weekly activity therefore came disproportionately from returning users.
Returning share also tells an interesting story
Returning users accounted for:
47.64% of activity on Jul 6
57.04% on Jul 13
68.73% on Jul 27
62.60% on Sep 14
That means the composition of weekly activity has shifted considerably since early July.
But there's an important distinction:
Returning activity ≠ retention
These are aggregate weekly activity figures.
They do not represent individual user cohorts, so they should not be interpreted as D7 or D30 retention.
Instead, they tell us how much weekly activity is coming from users who had already been active.
The bigger takeaway
New users tell us who showed up.
Returning users tell us who came back.
Both are important.
But they answer different questions.
For Robinhood Chain, the next metric worth watching may be the relationship between:
New-user momentum × returning-user activity
Because onchain growth isn't only about getting more wallets through the door.
It's also about what happens after they enter.
$HOOD
#Crypto #RobinhoodChain #Onchain #Blockchain #Web3