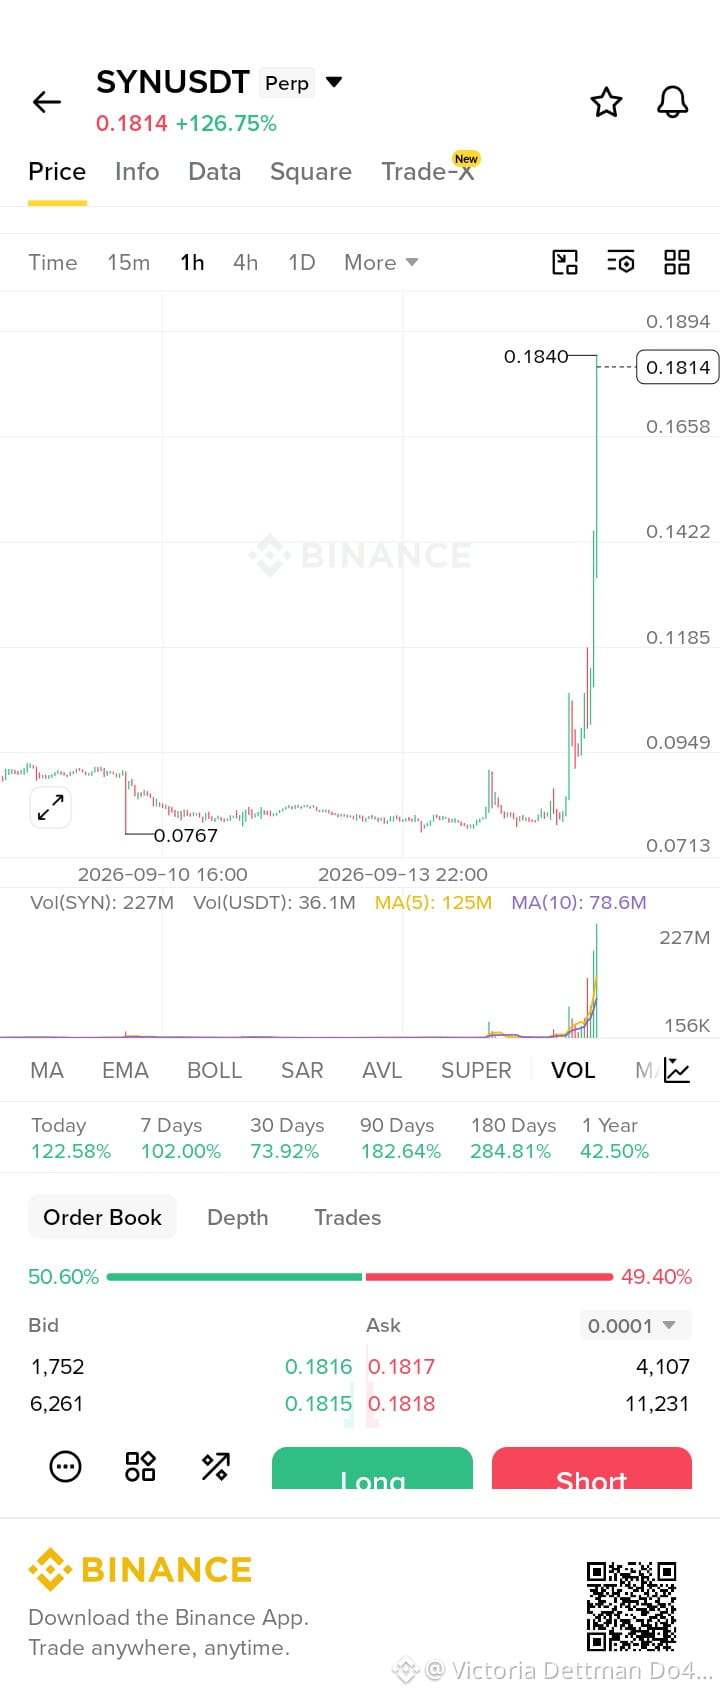
📊$SYN /USDT Perpetual — 1H Chart
Current price: around 0.1814 USDT
24h change: approximately +126.75%, showing a very strong upward move.
The chart shows a sharp breakout/pump from the 0.09–0.10 area toward 0.1840.
Recent high: around 0.1840, with the visible upper resistance near 0.1894.
Volume: has increased dramatically during the price surge, indicating very heavy trading activity.
The previous trading area was much lower, around 0.0767–0.0950, so the current price represents a major expansion from that range.
The order book shown is relatively balanced: Bids 50.60% vs Asks 49.40%, although this can change quickly.
🔎 Technical picture
The structure is currently strongly bullish, but after such a rapid move, volatility and pullbacks can be significant. The 0.1840–0.1894 region is important to watch for whether price continues higher or faces rejection.
Current price: around 0.1814 USDT
24h change: approximately +126.75%, showing a very strong upward move.
The chart shows a sharp breakout/pump from the 0.09–0.10 area toward 0.1840.
Recent high: around 0.1840, with the visible upper resistance near 0.1894.
Volume: has increased dramatically during the price surge, indicating very heavy trading activity.
The previous trading area was much lower, around 0.0767–0.0950, so the current price represents a major expansion from that range.
The order book shown is relatively balanced: Bids 50.60% vs Asks 49.40%, although this can change quickly.
🔎 Technical picture
The structure is currently strongly bullish, but after such a rapid move, volatility and pullbacks can be significant. The 0.1840–0.1894 region is important to watch for whether price continues higher or faces rejection.