#NEO LTF Analysis:
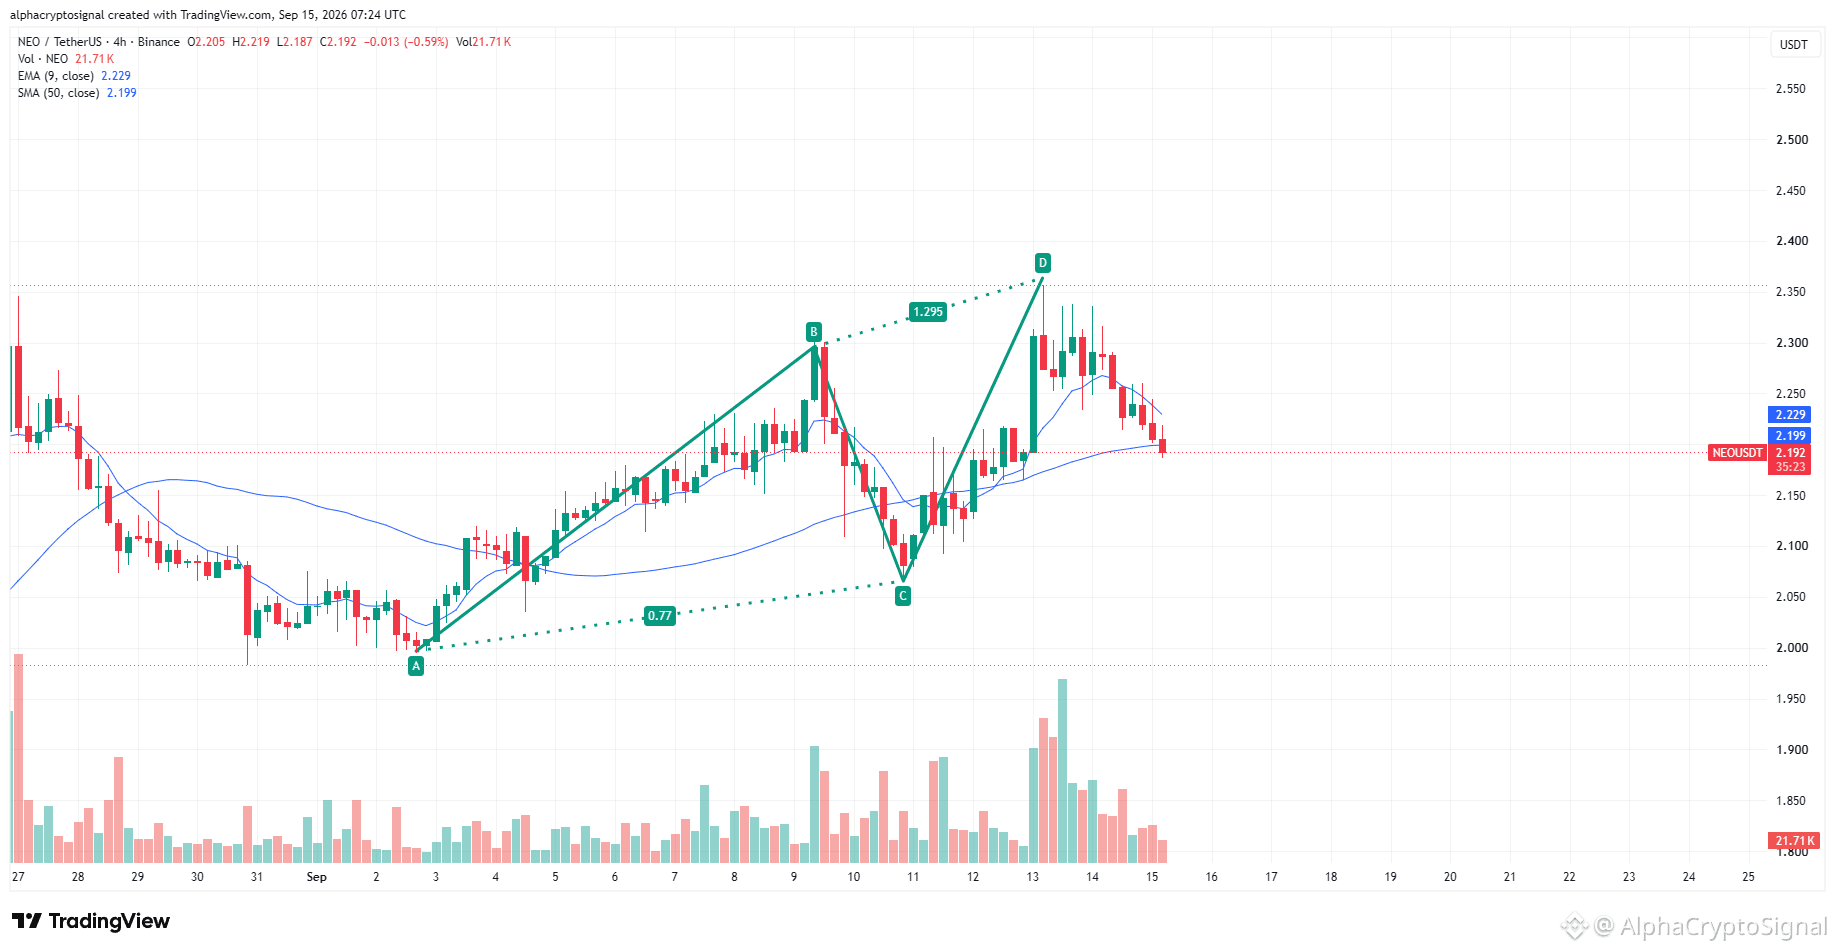
$NEO is forming a bearish ABCD pattern on the 4H chart, with price completing the D leg near the $2.35 area before getting rejected. The recent pullback suggests the pattern may be playing out, with bearish momentum building below the short-term moving averages.
As long as $NEO remains below the recent highs, another move lower is possible. A break below the $2.15–$2.10 area could confirm further downside and invalidate the bullish recovery structure.
$NEO is forming a bearish ABCD pattern on the 4H chart, with price completing the D leg near the $2.35 area before getting rejected. The recent pullback suggests the pattern may be playing out, with bearish momentum building below the short-term moving averages.
As long as $NEO remains below the recent highs, another move lower is possible. A break below the $2.15–$2.10 area could confirm further downside and invalidate the bullish recovery structure.