DAILY SIGNAL — SOL/USDT
Date: 15 Sep 2026 Timeframe: 1m Intraday Bias: Breakout → bullish consolidation → continuation attempt
📊 Market Bias
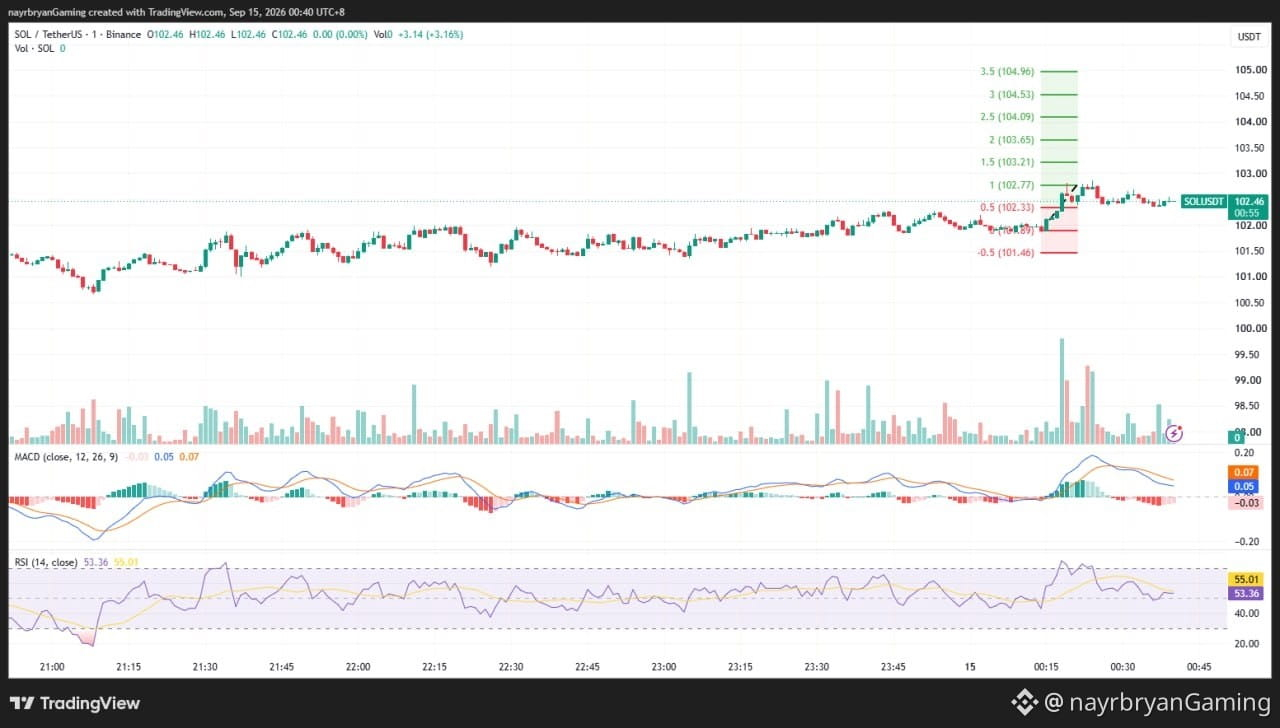
SOL has broken above the upper structure zone after trading inside a rising channel.
Price pushed through the 102.05–102.35 resistance area and briefly expanded toward the 102.77 Fibonacci level.
After the breakout, price is consolidating above the previous resistance zone, making the 102.05–102.35 area an important retest zone.
As long as this area continues to hold, the short-term structure remains constructive.
🔹 Key Levels From Chart
Key Retest / Support Zone: 102.05 → 102.35
Current Price: 102.43
First Fibonacci Target: 102.77
Key Upside Expansion: 103.21
Invalidation Reference: 101.46
🎯 Upside Fibonacci Targets
TP1 → 102.77 (1.0 Fib) TP2 → 103.21 (1.5 Fib) TP3 → 103.65 (2.0 Fib) TP4 → 104.09 (2.5 Fib) TP5 → 104.53 (3.0 Fib) TP6 → 104.96 (3.5 Fib)
🔻 Downside Reference
The chart marks:
101.46 (-0.5 Fib)
A sustained move back below the 102.05–102.35 structure would weaken the immediate bullish continuation thesis.
📈 Technical Breakdown
SOL spent a prolonged period moving within an ascending structure before finally expanding above the purple resistance zone.
The breakout was accompanied by increased volume, followed by consolidation around 102.40+.
Price is currently holding above the previous resistance area, which is important because a successful retest can turn former resistance into support.
MACD remains positive, although the histogram is cooling and the MACD lines are starting to roll over.
RSI is around 51.47, indicating neutral-to-slightly bullish momentum rather than an overbought condition.
The key observation is whether buyers can defend the breakout area.
A successful hold above 102.05–102.35 keeps the upside Fibonacci sequence in focus:
102.77 → 103.21 → 103.65 → 104.09
🧠 Quick Insight
“A breakout becomes stronger when old resistance successfully turns into support.”
⚠️ Disclaimer
This is personal market analysis, not financial advice.
Date: 15 Sep 2026 Timeframe: 1m Intraday Bias: Breakout → bullish consolidation → continuation attempt
📊 Market Bias
SOL has broken above the upper structure zone after trading inside a rising channel.
Price pushed through the 102.05–102.35 resistance area and briefly expanded toward the 102.77 Fibonacci level.
After the breakout, price is consolidating above the previous resistance zone, making the 102.05–102.35 area an important retest zone.
As long as this area continues to hold, the short-term structure remains constructive.
🔹 Key Levels From Chart
Key Retest / Support Zone: 102.05 → 102.35
Current Price: 102.43
First Fibonacci Target: 102.77
Key Upside Expansion: 103.21
Invalidation Reference: 101.46
🎯 Upside Fibonacci Targets
TP1 → 102.77 (1.0 Fib) TP2 → 103.21 (1.5 Fib) TP3 → 103.65 (2.0 Fib) TP4 → 104.09 (2.5 Fib) TP5 → 104.53 (3.0 Fib) TP6 → 104.96 (3.5 Fib)
🔻 Downside Reference
The chart marks:
101.46 (-0.5 Fib)
A sustained move back below the 102.05–102.35 structure would weaken the immediate bullish continuation thesis.
📈 Technical Breakdown
SOL spent a prolonged period moving within an ascending structure before finally expanding above the purple resistance zone.
The breakout was accompanied by increased volume, followed by consolidation around 102.40+.
Price is currently holding above the previous resistance area, which is important because a successful retest can turn former resistance into support.
MACD remains positive, although the histogram is cooling and the MACD lines are starting to roll over.
RSI is around 51.47, indicating neutral-to-slightly bullish momentum rather than an overbought condition.
The key observation is whether buyers can defend the breakout area.
A successful hold above 102.05–102.35 keeps the upside Fibonacci sequence in focus:
102.77 → 103.21 → 103.65 → 104.09
🧠 Quick Insight
“A breakout becomes stronger when old resistance successfully turns into support.”
⚠️ Disclaimer
This is personal market analysis, not financial advice.