Trendlines vs Horizontal Levels: Which One Should Beginners Trust More?
When beginners learn technical analysis, two tools often appear immediately:
📈 Trendlines
📏 Horizontal Support & Resistance
But which one deserves more trust?
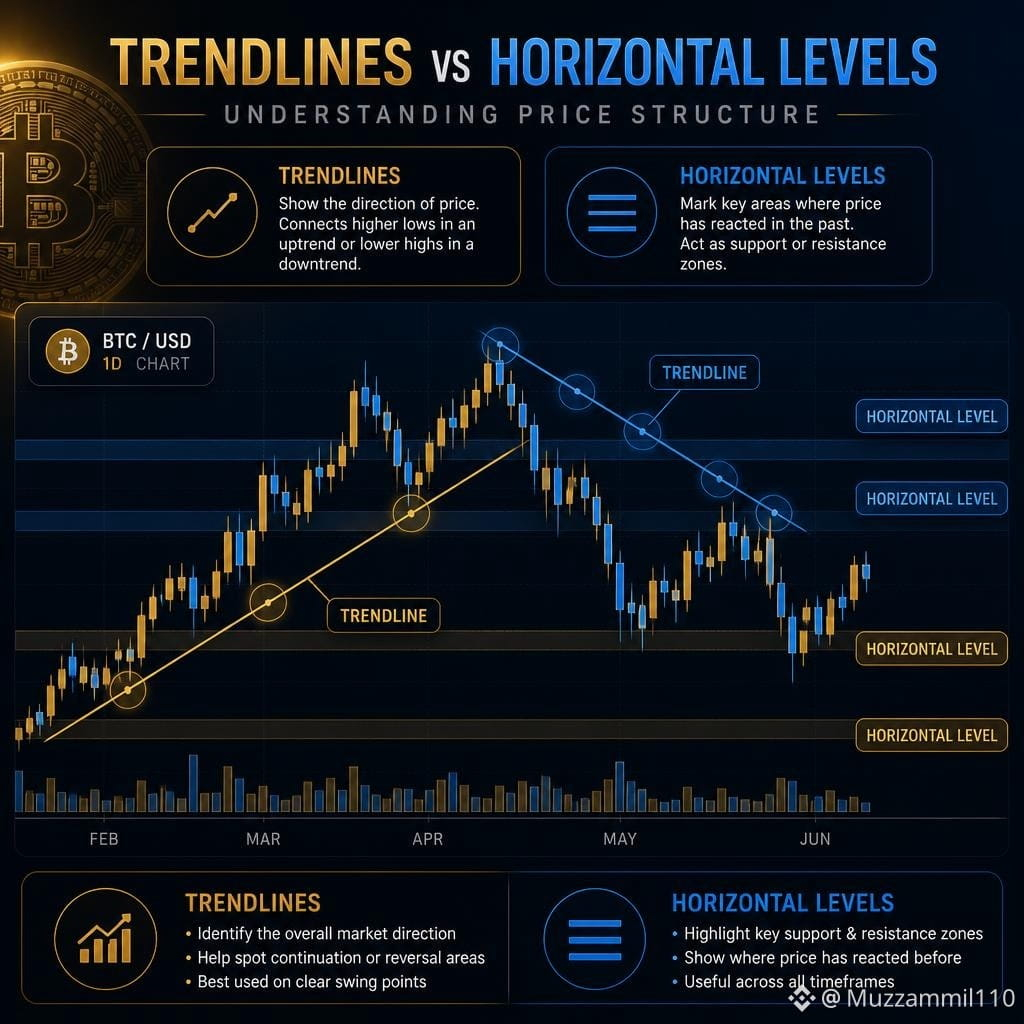
🔹 Trendlines
Trendlines connect important swing highs or swing lows to help visualize the direction of price.
They can be useful for identifying:
• Uptrends
• Downtrends
• Changing momentum
• Dynamic areas of interest
The limitation?
Different traders may draw trendlines slightly differently.
🔹 Horizontal Levels
Horizontal levels mark areas where price has previously reacted.
They can help identify:
• Support
• Resistance
• Previous reaction zones
• Important price areas
Their major advantage is that they are easier to compare across different charts and timeframes.
So Which Is Better?
For beginners, horizontal levels can often provide a clearer starting point because they are less subjective.
But that doesn't make trendlines useless.
A stronger analysis can combine both.
For example:
Horizontal level + trendline + volume + market structure
can provide more context than relying on one tool alone.
The Key Lesson
Don't ask:
“Which tool is always correct?”
Instead ask:
“What does the price structure show, and does the tool support that observation?”
Technical analysis works better as a framework for understanding market behavior—not as a guarantee of what happens next.
💬 Which do you prefer: Trendlines, Horizontal Levels, or Both?
Educational content only — not financial advice.
#Bitcoin #BTC #Trendlines #SupportAndResistance #TechnicalAnalysis #CryptoEducation #PriceAction #MarketStructure #TradingEducation #CryptoTrading #CryptoWithAli #BinanceSquare
🕧 Post 2 — 12:30 AM PKT
📊 Quick Technical Analysis Poll
Your preference →
🔘 Trendlines
🔘 Horizontal Levels
🔘 Both
Which one do you find easier to use when studying a crypto chart?
💬 Tell us why in the comments.
When beginners learn technical analysis, two tools often appear immediately:
📈 Trendlines
📏 Horizontal Support & Resistance
But which one deserves more trust?
🔹 Trendlines
Trendlines connect important swing highs or swing lows to help visualize the direction of price.
They can be useful for identifying:
• Uptrends
• Downtrends
• Changing momentum
• Dynamic areas of interest
The limitation?
Different traders may draw trendlines slightly differently.
🔹 Horizontal Levels
Horizontal levels mark areas where price has previously reacted.
They can help identify:
• Support
• Resistance
• Previous reaction zones
• Important price areas
Their major advantage is that they are easier to compare across different charts and timeframes.
So Which Is Better?
For beginners, horizontal levels can often provide a clearer starting point because they are less subjective.
But that doesn't make trendlines useless.
A stronger analysis can combine both.
For example:
Horizontal level + trendline + volume + market structure
can provide more context than relying on one tool alone.
The Key Lesson
Don't ask:
“Which tool is always correct?”
Instead ask:
“What does the price structure show, and does the tool support that observation?”
Technical analysis works better as a framework for understanding market behavior—not as a guarantee of what happens next.
💬 Which do you prefer: Trendlines, Horizontal Levels, or Both?
Educational content only — not financial advice.
#Bitcoin #BTC #Trendlines #SupportAndResistance #TechnicalAnalysis #CryptoEducation #PriceAction #MarketStructure #TradingEducation #CryptoTrading #CryptoWithAli #BinanceSquare
🕧 Post 2 — 12:30 AM PKT
📊 Quick Technical Analysis Poll
Your preference →
🔘 Trendlines
🔘 Horizontal Levels
🔘 Both
Which one do you find easier to use when studying a crypto chart?
💬 Tell us why in the comments.