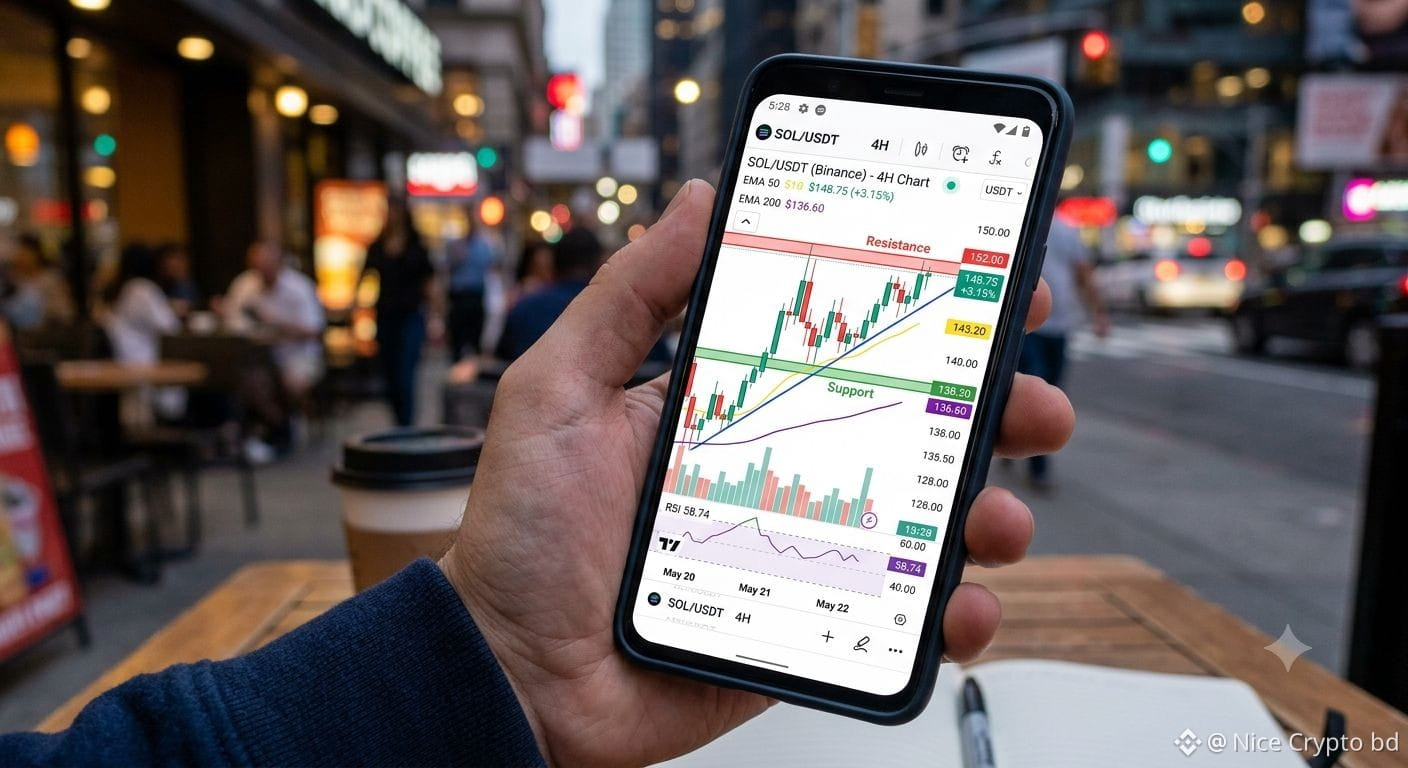
Here is the technical analysis based directly on the SOL/USDT (1-Day) chart you provided:
Solana (SOL) Daily Chart Technical Analysis
Current Price Action: SOL is trading at $99.77 (-1.49% over 24 hours). The price recently experienced a downward trend from a high near $107.36, dropping to a low of $98.50 before attempting a minor rebound.
Key Levels:
Immediate Support: $98.50 – $97.38 (Recent swing lows visible on the chart).
Immediate Resistance: $101.54 – $103.47 (24h high and minor consolidation area).
Major Resistance: $107.36 (Recent peak).
24-Hour Trading Data:
24h High: $101.54
24h Low: $98.50
24h Volume (SOL): 2.00M
24h Volume (USDT): 200.02M
Technical Indicators:
Stochastic RSI: STOCHRSI (2.44) and MASTOCHRSI (0.81) are both deep in the oversold zone (below 20). This suggests strong downward pressure recently, but also hints at a potential short-term bounce or consolidation as selling pressure exhausts.
Market Outlook
The short-term trend on the daily chart remains bearish to neutral. If SOL holds above the $98.50 support, it may attempt a corrective pull-back toward the $101.54 – $103.47 resistance range. Conversely, a breakdown below $97.38 could extend the bearish momentum toward lower support levels.
#solana #CryptoPatience
Solana (SOL) Daily Chart Technical Analysis
Current Price Action: SOL is trading at $99.77 (-1.49% over 24 hours). The price recently experienced a downward trend from a high near $107.36, dropping to a low of $98.50 before attempting a minor rebound.
Key Levels:
Immediate Support: $98.50 – $97.38 (Recent swing lows visible on the chart).
Immediate Resistance: $101.54 – $103.47 (24h high and minor consolidation area).
Major Resistance: $107.36 (Recent peak).
24-Hour Trading Data:
24h High: $101.54
24h Low: $98.50
24h Volume (SOL): 2.00M
24h Volume (USDT): 200.02M
Technical Indicators:
Stochastic RSI: STOCHRSI (2.44) and MASTOCHRSI (0.81) are both deep in the oversold zone (below 20). This suggests strong downward pressure recently, but also hints at a potential short-term bounce or consolidation as selling pressure exhausts.
Market Outlook
The short-term trend on the daily chart remains bearish to neutral. If SOL holds above the $98.50 support, it may attempt a corrective pull-back toward the $101.54 – $103.47 resistance range. Conversely, a breakdown below $97.38 could extend the bearish momentum toward lower support levels.
#solana #CryptoPatience