🚨 Another Bearish Wave for $BTC After Breakout Fail 🔻🔻🔻🔻
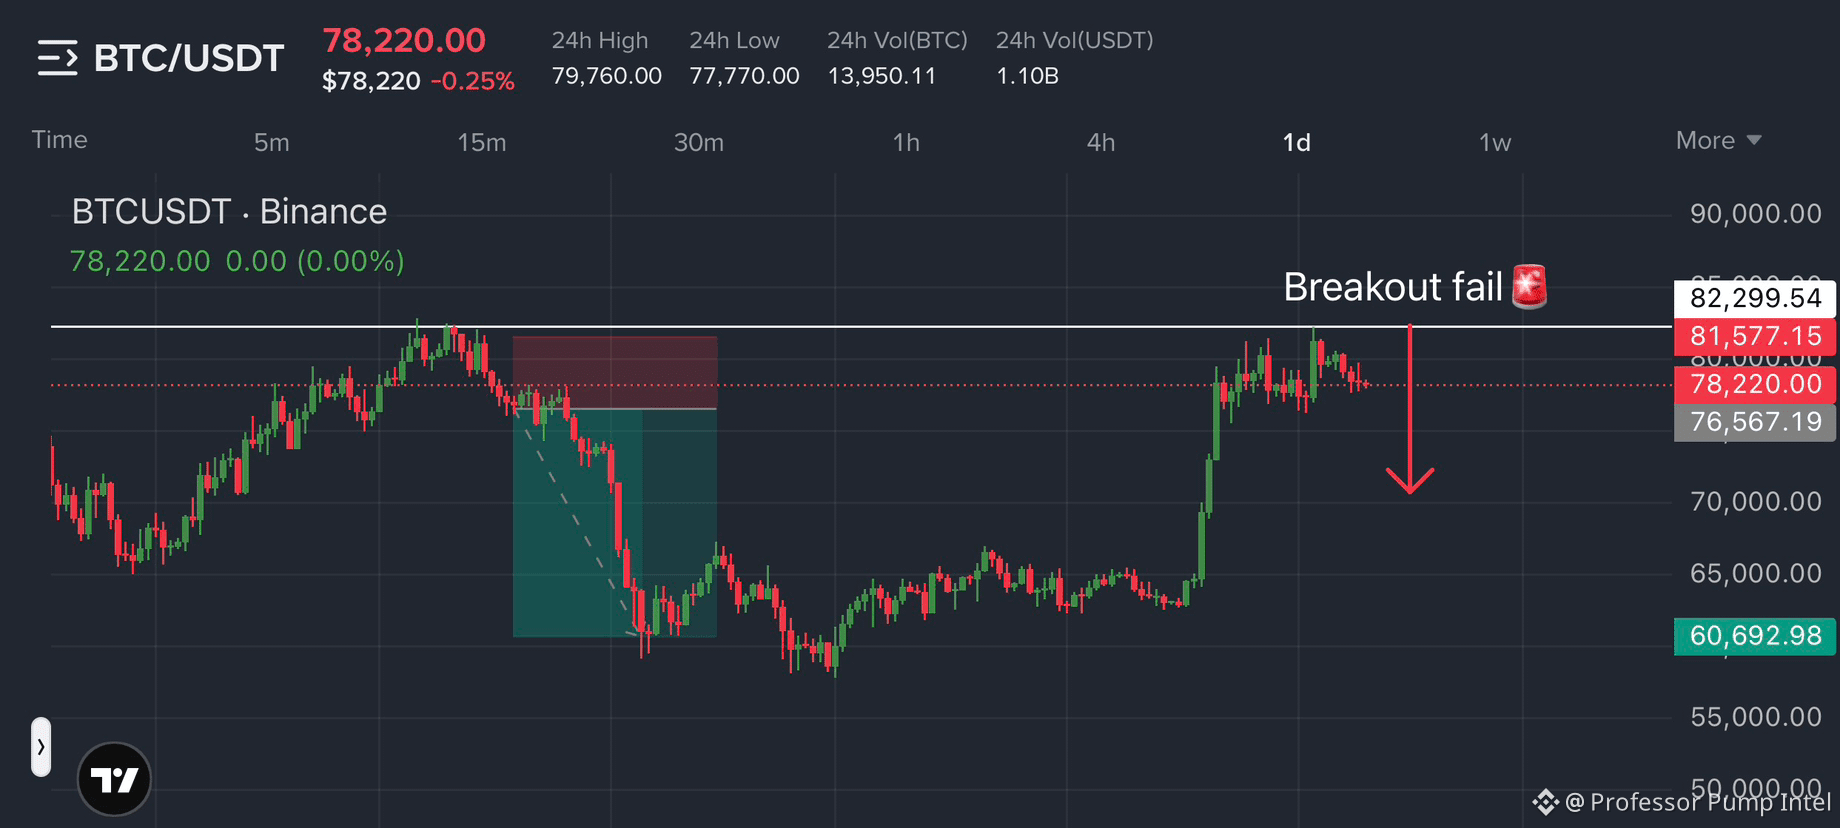
Bitcoin is showing a clear rejection from the $81,500 to $82,300 resistance zone, and the daily chart is now presenting a technically important decision point. After a strong recovery from the $60,692 area, BTC pushed into resistance but failed to establish a convincing breakout. The latest candles suggest that buyers are losing momentum near the highs, while sellers are attempting to reclaim control.
The key level to watch is $81,577. A daily close above this area, followed by a successful retest, would weaken the bearish setup and could open the door toward $82,300 and potentially higher levels. Until that happens, the failed breakout remains a warning that the market may be preparing for a deeper correction.
On the downside, $78,220 is the immediate area of interest. A decisive break below this level could accelerate selling toward $76,567, which is the next important support visible on the chart. If that support also fails, the recovery structure would face significantly greater pressure.
The chart is not confirming a major breakdown yet, but the risk of further downside is increasing. Traders should watch the daily closes carefully rather than assuming the rejection guarantees a collapse.
Key levels:
Resistance: $81,577 to $82,300
Support: $78,220 and $76,567
Bias: Bearish below resistance, bullish only after confirmed breakout.
Click here 👉 $BTC 👈 to Trade.
#bitcoin #btcbreakdown #BTCUSDT #FailedBreakout #analysis
Bitcoin is showing a clear rejection from the $81,500 to $82,300 resistance zone, and the daily chart is now presenting a technically important decision point. After a strong recovery from the $60,692 area, BTC pushed into resistance but failed to establish a convincing breakout. The latest candles suggest that buyers are losing momentum near the highs, while sellers are attempting to reclaim control.
The key level to watch is $81,577. A daily close above this area, followed by a successful retest, would weaken the bearish setup and could open the door toward $82,300 and potentially higher levels. Until that happens, the failed breakout remains a warning that the market may be preparing for a deeper correction.
On the downside, $78,220 is the immediate area of interest. A decisive break below this level could accelerate selling toward $76,567, which is the next important support visible on the chart. If that support also fails, the recovery structure would face significantly greater pressure.
The chart is not confirming a major breakdown yet, but the risk of further downside is increasing. Traders should watch the daily closes carefully rather than assuming the rejection guarantees a collapse.
Key levels:
Resistance: $81,577 to $82,300
Support: $78,220 and $76,567
Bias: Bearish below resistance, bullish only after confirmed breakout.
Click here 👉 $BTC 👈 to Trade.
#bitcoin #btcbreakdown #BTCUSDT #FailedBreakout #analysis