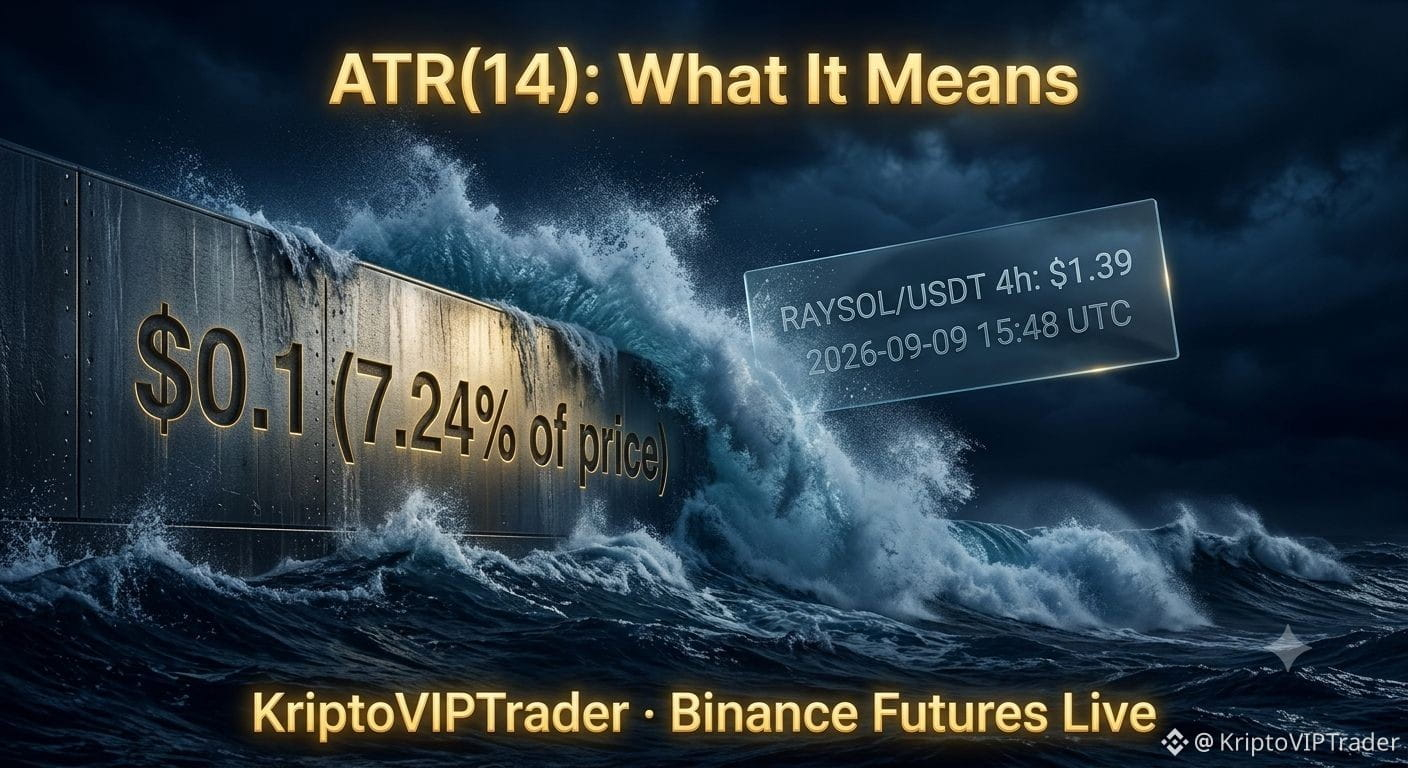
Forget guessing direction for a second. Let's talk volatility. Specifically, the Average True Range (ATR) on the **4-hour chart** for RAYSOL
The ATR doesn't tell you *where* the price is going (it’s not bullish or bearish). It measures pure volatility: how much the price typically moves, max range, in a single 4-hour candle.
Right now, that reading is **$0.1 (7.24% of price)**.
Context is everything. RAYSOL is currently up **+24.14%** over the last 24 hours. The multi-day trend has shown significant strength. This $0.1 ATR value means that even when RAYSOL looks like it’s just consolidating sideways, the *typical* price movement within each 4-hour block is quite substantial—around 7.24% of its $1.39 price.
Understanding this 4-hour volatility is crucial. A market moving $0.1 every few hours requires a completely different approach than one moving pennies.
$RAYSOL #volatility #Write2Earn
👉 Follow & learn — new signals daily
#BrentCrudeTops100
The ATR doesn't tell you *where* the price is going (it’s not bullish or bearish). It measures pure volatility: how much the price typically moves, max range, in a single 4-hour candle.
Right now, that reading is **$0.1 (7.24% of price)**.
Context is everything. RAYSOL is currently up **+24.14%** over the last 24 hours. The multi-day trend has shown significant strength. This $0.1 ATR value means that even when RAYSOL looks like it’s just consolidating sideways, the *typical* price movement within each 4-hour block is quite substantial—around 7.24% of its $1.39 price.
Understanding this 4-hour volatility is crucial. A market moving $0.1 every few hours requires a completely different approach than one moving pennies.
$RAYSOL #volatility #Write2Earn
👉 Follow & learn — new signals daily
#BrentCrudeTops100