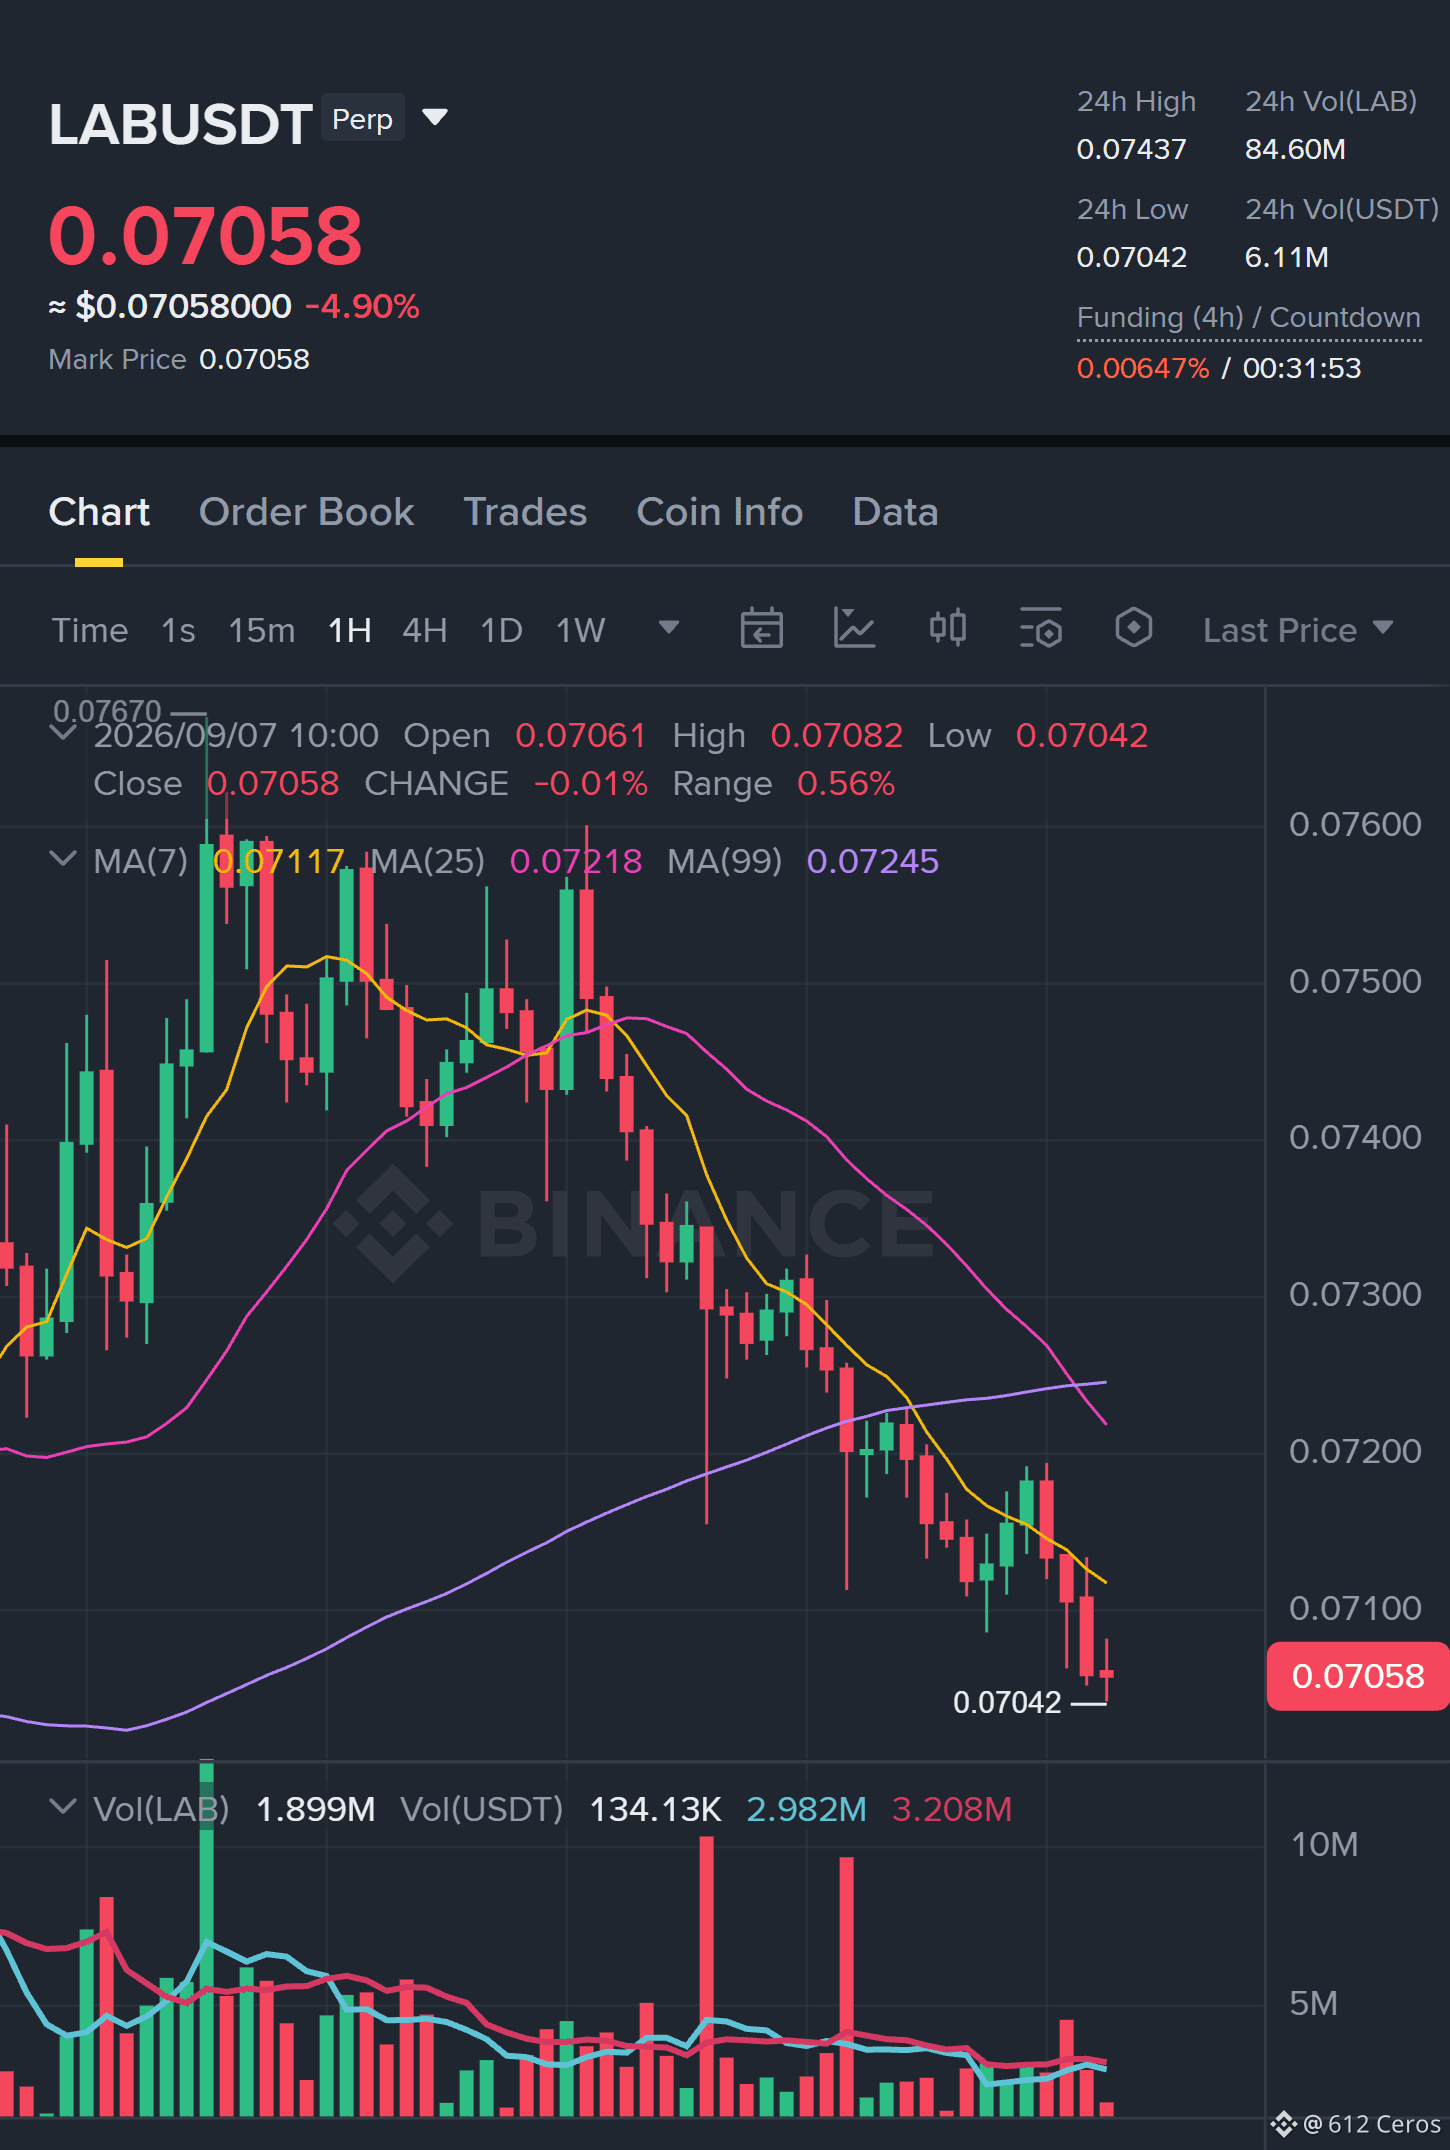
Everyone is watching $LAB /USDT bounce—but the 4h chart says the real move is still down.
$LAB - 🟢 SHORT · Conf 85%
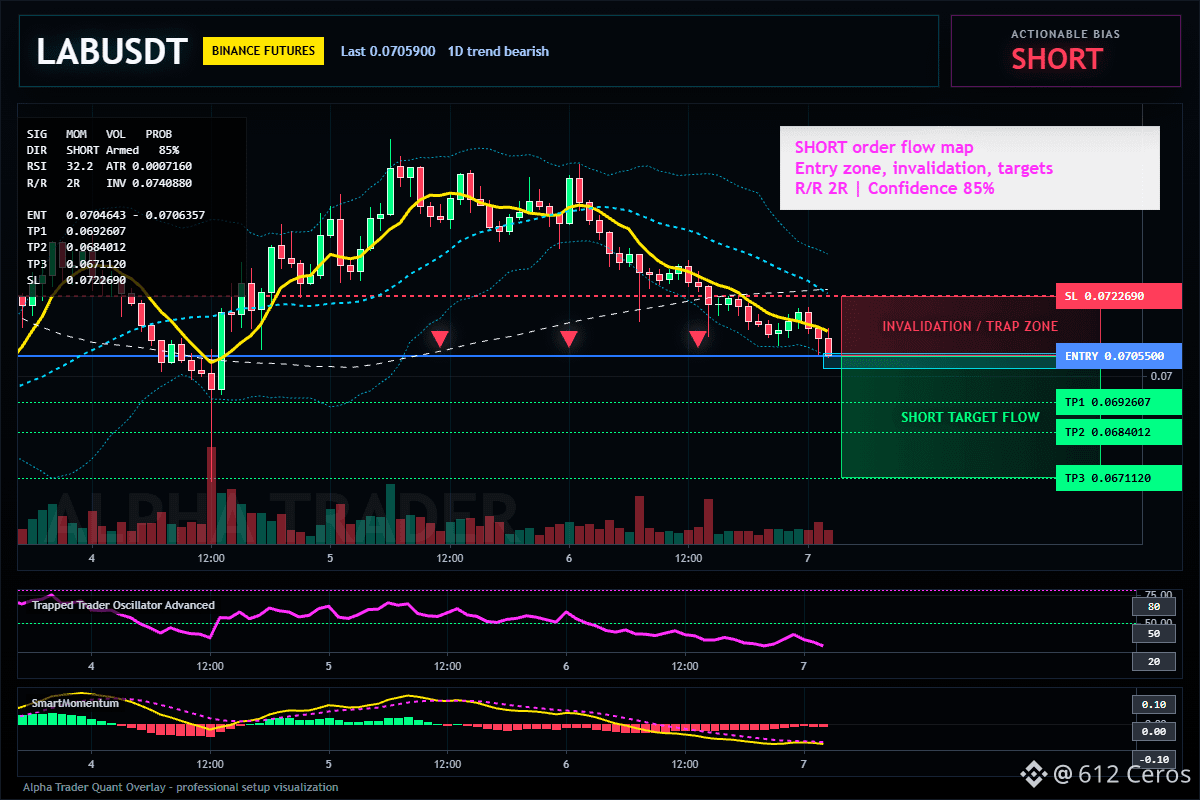
Trade Plan:
Entry: 0.0704643 – 0.0706357
SL: 0.0722690
TP1: 0.0692607
TP2: 0.0684012
TP3: 0.0671120
Why this setup?
- Why now? The 1D trend is bearish, and our 4h setup is a clean trend-following SHORT with 85% confidence.
- RSI on the 15m is at 32.22—showing weakness on every relief pop, not strength.
- Entry zone is tight around 0.07055, with TP1 at 0.06926 and TP2 at 0.06840. The path of least resistance is lower.
- This is NOT a counter-trend gamble; it aligns with the higher timeframe. But remember, no setup is a sure thing—respect the stop at 0.07227.
Debate:
If $LAB taps 0.06926, do you think it slices through to 0.06840 or does the bear trap snap shut first?
Click here to view the chart 👇️
⚠️ Personal market analysis only. NFA — manage risk and DYOR.
Educational content, not investment advice or a recommendation to buy, sell, deposit, or withdraw any asset. No paid promotion or referral/affiliate links.
$LAB - 🟢 SHORT · Conf 85%
Trade Plan:
Entry: 0.0704643 – 0.0706357
SL: 0.0722690
TP1: 0.0692607
TP2: 0.0684012
TP3: 0.0671120
Why this setup?
- Why now? The 1D trend is bearish, and our 4h setup is a clean trend-following SHORT with 85% confidence.
- RSI on the 15m is at 32.22—showing weakness on every relief pop, not strength.
- Entry zone is tight around 0.07055, with TP1 at 0.06926 and TP2 at 0.06840. The path of least resistance is lower.
- This is NOT a counter-trend gamble; it aligns with the higher timeframe. But remember, no setup is a sure thing—respect the stop at 0.07227.
Debate:
If $LAB taps 0.06926, do you think it slices through to 0.06840 or does the bear trap snap shut first?
Click here to view the chart 👇️
⚠️ Personal market analysis only. NFA — manage risk and DYOR.
Educational content, not investment advice or a recommendation to buy, sell, deposit, or withdraw any asset. No paid promotion or referral/affiliate links.