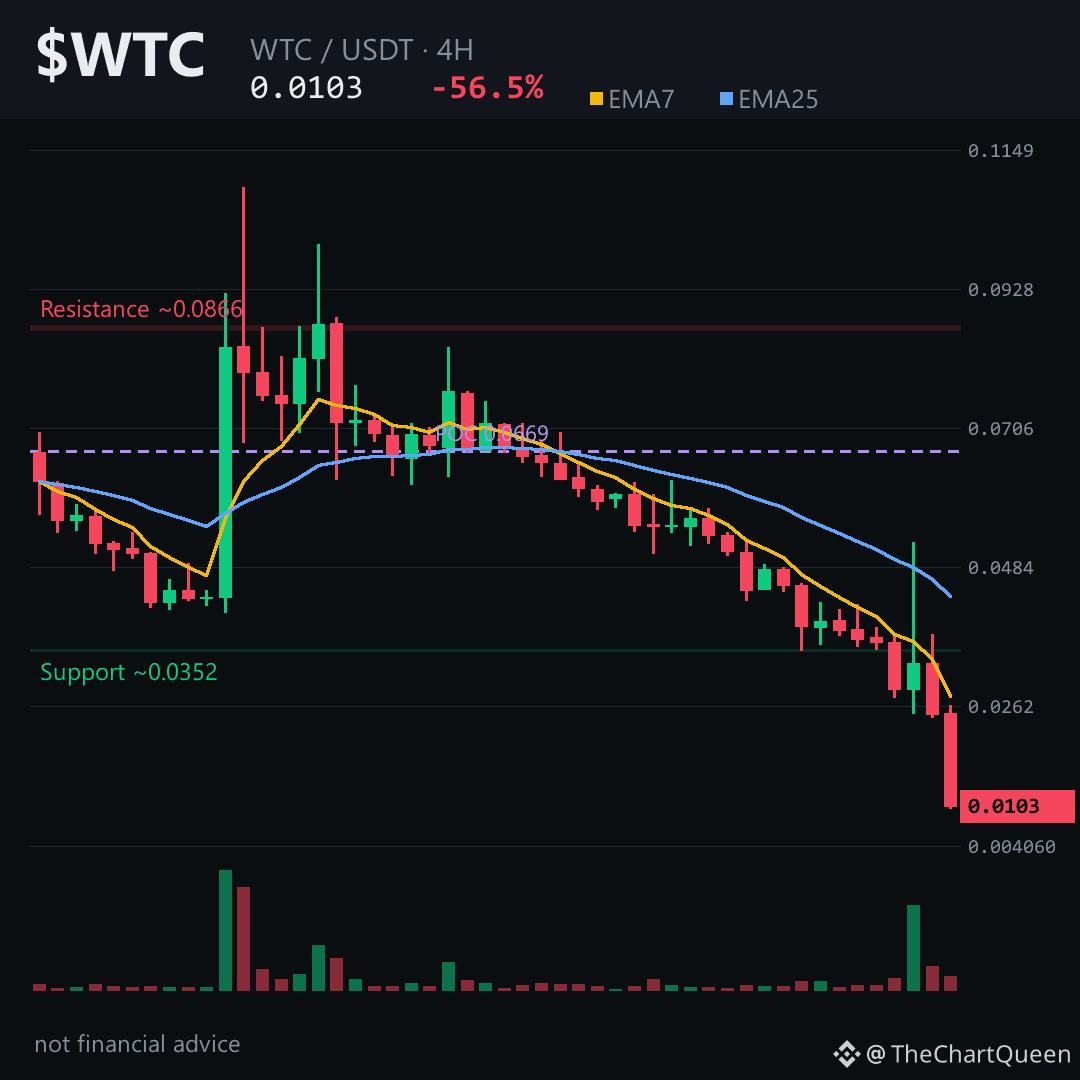
The 4‑hour chart just slipped below the ~0.0105 zone—now $WTC is staring at a 0.0094 trap. Here’s why you should care 👇
Price looks brutally bearish, but the internals whisper a hidden snag: EMA7 sits well under EMA25, RSI is stuck around 20, and the 4H volume profile’s point‑of‑control sits at ~0.0669, far above today’s price. On the daily, a bearish FVG sits between 0.0577 – 0.0540, hinting at lingering supply pressure. Funding is flat at 0%, and open interest is essentially zero, suggesting the market is thin and ready to swing on the next move.
If $WTC loses the ~0.0103 area on a 4‑hour close, the next leg heads toward the 0.0094 zone. Hold the line above the ~0.0109 ceiling and the bearish story could stall; break that and the objective drops deeper. Tap $WTC to pull up the chart and see these zones yourself.
My read: WTC will likely slide toward the low‑0.0094 area unless it punches back above the ~0.0109 barrier.
Follow me for the next update when WTC either breaks the 0.0109 ceiling or settles into the 0.0094 floor. What do you think WTC will respect first – the 0.0109 ceiling or the 0.0094 floor? 👇
⚠️ Not financial advice. DYOR.
#WTC #Crypto #BinanceSquare #TopLoser #CryptoAnalysis
Price looks brutally bearish, but the internals whisper a hidden snag: EMA7 sits well under EMA25, RSI is stuck around 20, and the 4H volume profile’s point‑of‑control sits at ~0.0669, far above today’s price. On the daily, a bearish FVG sits between 0.0577 – 0.0540, hinting at lingering supply pressure. Funding is flat at 0%, and open interest is essentially zero, suggesting the market is thin and ready to swing on the next move.
If $WTC loses the ~0.0103 area on a 4‑hour close, the next leg heads toward the 0.0094 zone. Hold the line above the ~0.0109 ceiling and the bearish story could stall; break that and the objective drops deeper. Tap $WTC to pull up the chart and see these zones yourself.
My read: WTC will likely slide toward the low‑0.0094 area unless it punches back above the ~0.0109 barrier.
Follow me for the next update when WTC either breaks the 0.0109 ceiling or settles into the 0.0094 floor. What do you think WTC will respect first – the 0.0109 ceiling or the 0.0094 floor? 👇
⚠️ Not financial advice. DYOR.
#WTC #Crypto #BinanceSquare #TopLoser #CryptoAnalysis