Everyone is looking at the 15m RSI panic, but the 1D trend says you are looking at the wrong chart.
$USELESS /USDT - 🟢 LONG · Conf 66%
Trade Plan:
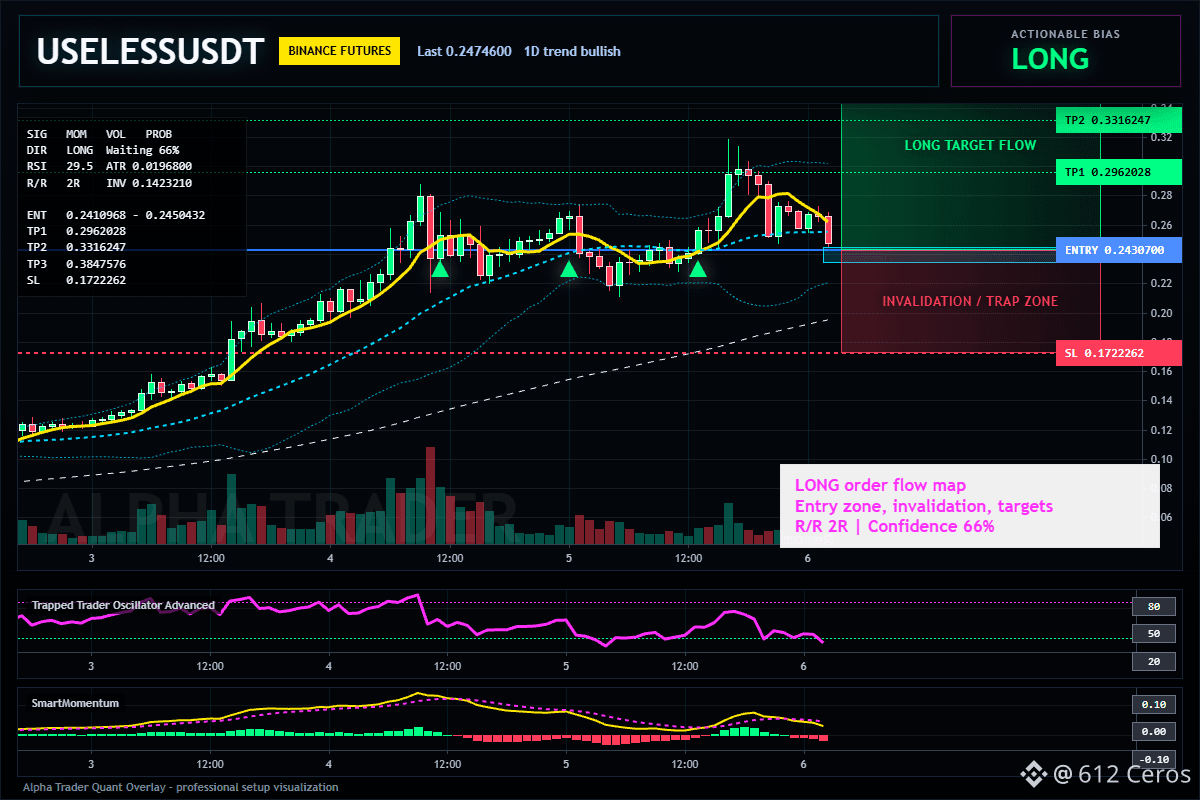
Entry: 0.2410968 – 0.2450432
SL: 0.1722262
TP1: 0.2962028
TP2: 0.3316247
TP3: 0.3847576
Why this setup?
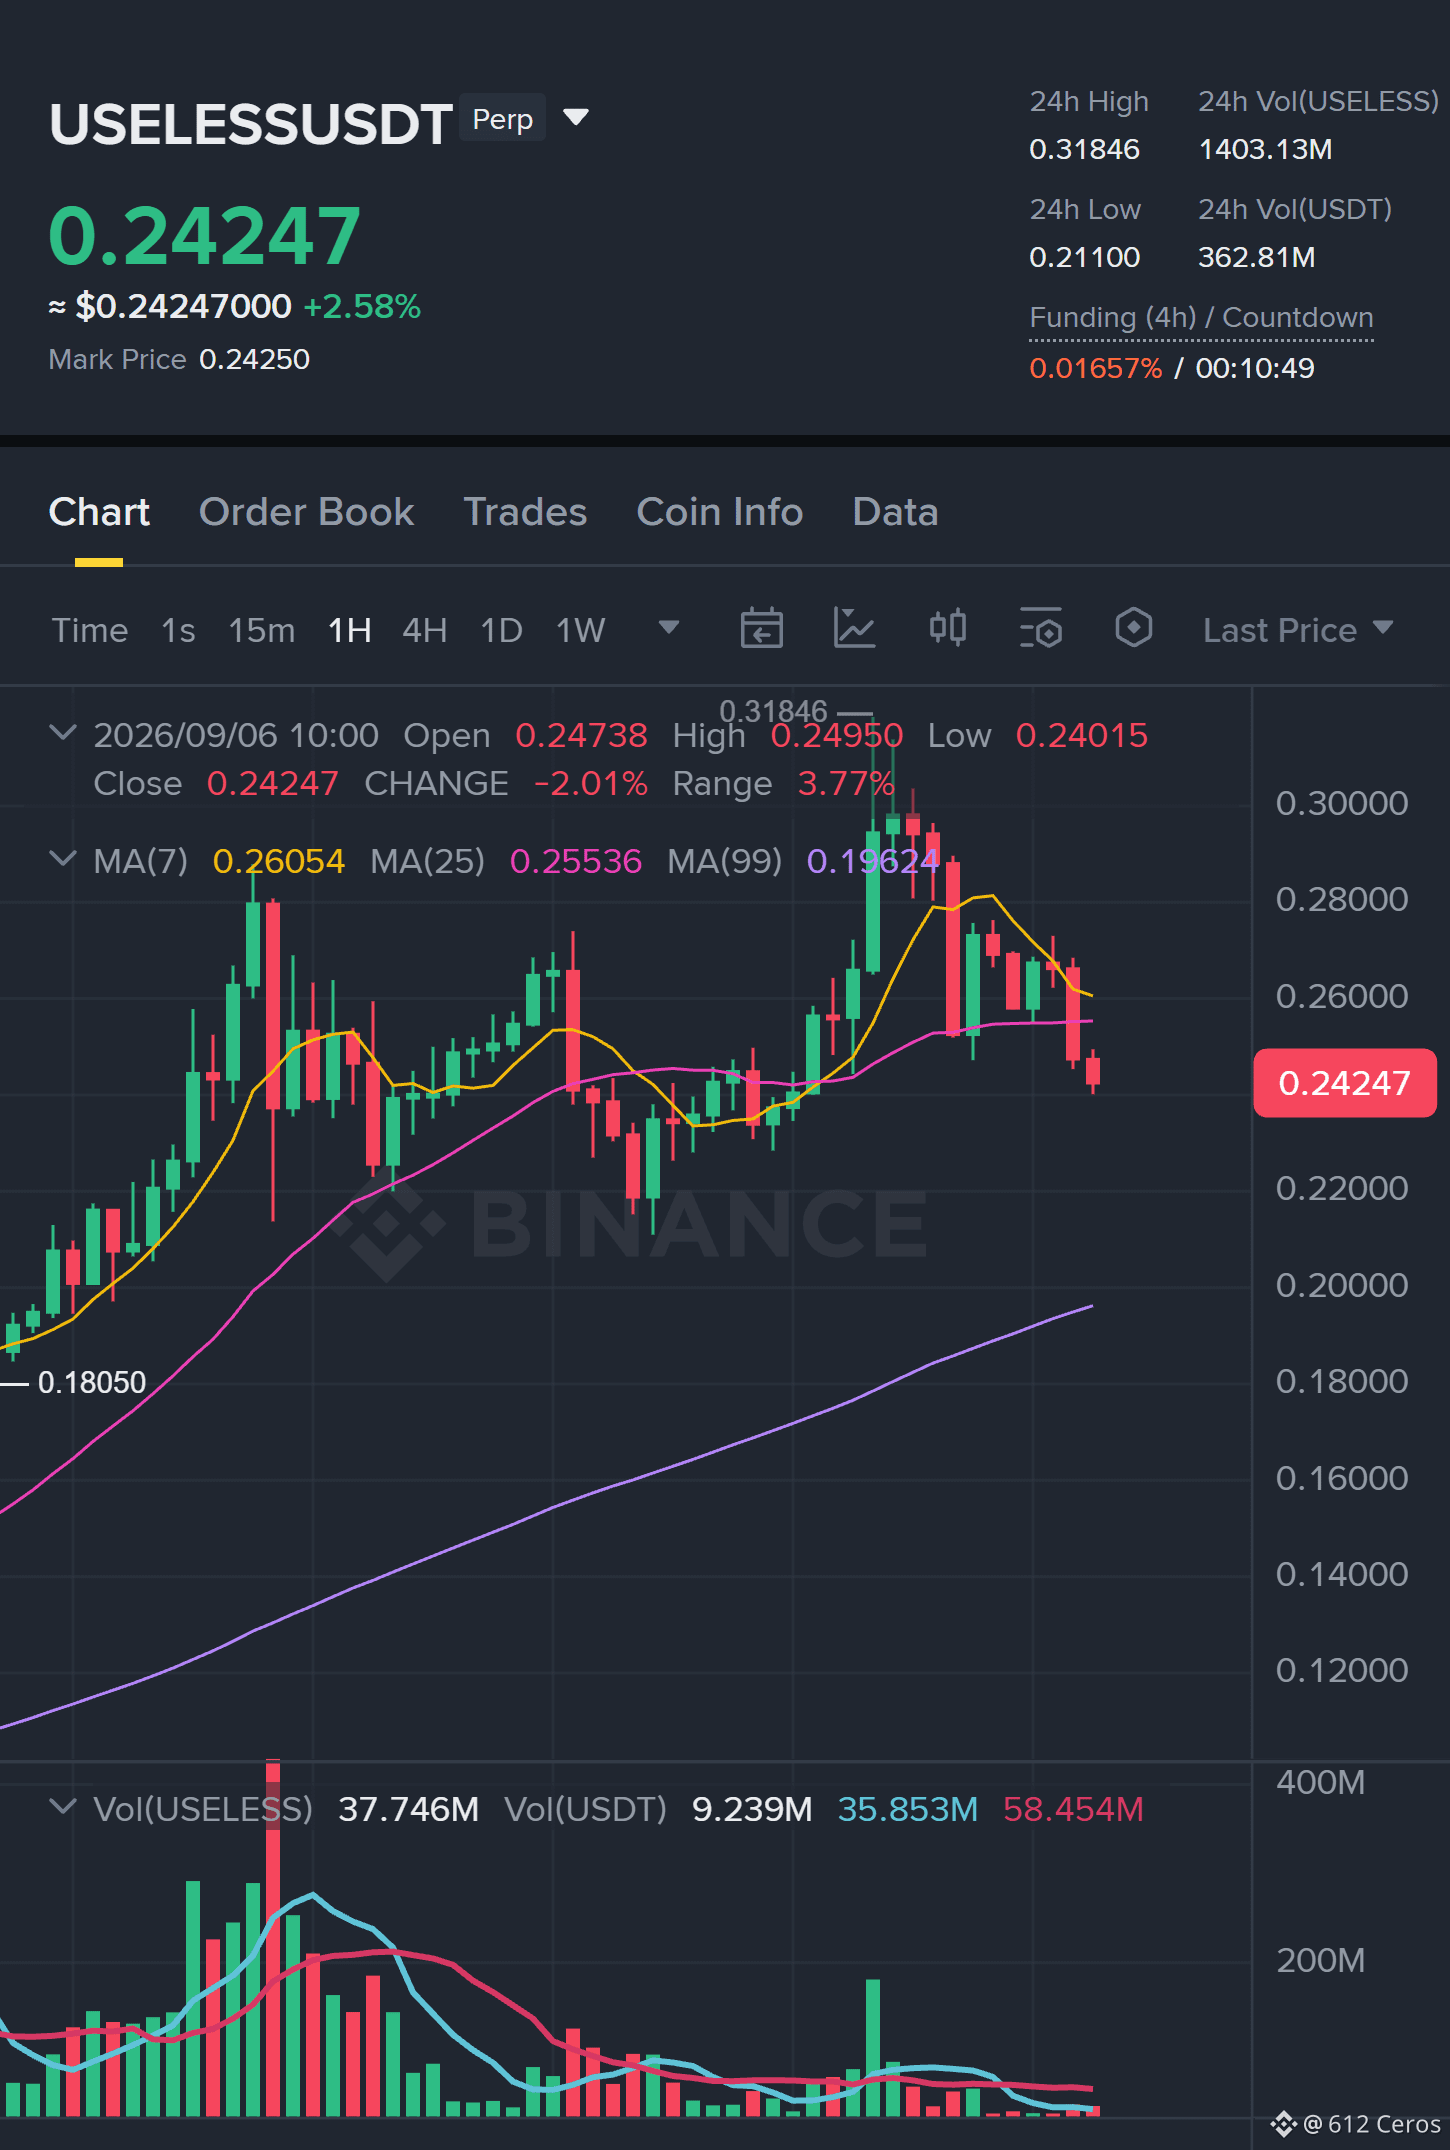
- The 15-minute RSI is screaming oversold at 29.46, which usually triggers retail fear, but the higher timeframe (4H) is still in a bullish trend regime.
- This is a trend-following LONG setup, not a counter-trend gamble. The daily bias is bullish, and we are simply buying a dip within that uptrend.
- The entry zone is tight: 0.2410968 to 0.2450432. Price is currently hovering at 0.2430700, giving you a defined risk to the stop at 0.1722262.
- Why now? The 1H ATR is 0.01968, meaning volatility is compressed. When volatility compresses inside a bullish 1D trend, expansion usually follows in the direction of the larger trend.
- Targets are stacked: TP1 at 0.2962, TP2 at 0.3316, TP3 at 0.3847. The asymmetry is roughly 1:2.5 risk-to-reward on the first target alone.
- Confirmation count is zero, so this is an early entry. You are front-running the crowd before the 4H momentum confirms the bounce.
Debate:
If the 1D trend is your compass, does a 15m RSI of 29 make you a buyer or a coward?
Click here to view the chart 👇️
⚠️ Personal market analysis only. NFA — manage risk and DYOR.
Educational content, not investment advice or a recommendation to buy, sell, deposit, or withdraw any asset. No paid promotion or referral/affiliate links.
$USELESS /USDT - 🟢 LONG · Conf 66%
Trade Plan:
Entry: 0.2410968 – 0.2450432
SL: 0.1722262
TP1: 0.2962028
TP2: 0.3316247
TP3: 0.3847576
Why this setup?
- The 15-minute RSI is screaming oversold at 29.46, which usually triggers retail fear, but the higher timeframe (4H) is still in a bullish trend regime.
- This is a trend-following LONG setup, not a counter-trend gamble. The daily bias is bullish, and we are simply buying a dip within that uptrend.
- The entry zone is tight: 0.2410968 to 0.2450432. Price is currently hovering at 0.2430700, giving you a defined risk to the stop at 0.1722262.
- Why now? The 1H ATR is 0.01968, meaning volatility is compressed. When volatility compresses inside a bullish 1D trend, expansion usually follows in the direction of the larger trend.
- Targets are stacked: TP1 at 0.2962, TP2 at 0.3316, TP3 at 0.3847. The asymmetry is roughly 1:2.5 risk-to-reward on the first target alone.
- Confirmation count is zero, so this is an early entry. You are front-running the crowd before the 4H momentum confirms the bounce.
Debate:
If the 1D trend is your compass, does a 15m RSI of 29 make you a buyer or a coward?
Click here to view the chart 👇️
⚠️ Personal market analysis only. NFA — manage risk and DYOR.
Educational content, not investment advice or a recommendation to buy, sell, deposit, or withdraw any asset. No paid promotion or referral/affiliate links.