🚀 #BTC/USDT Analysis: Retesting Key Psychological Zone & Historical Monthly Trends! 📊
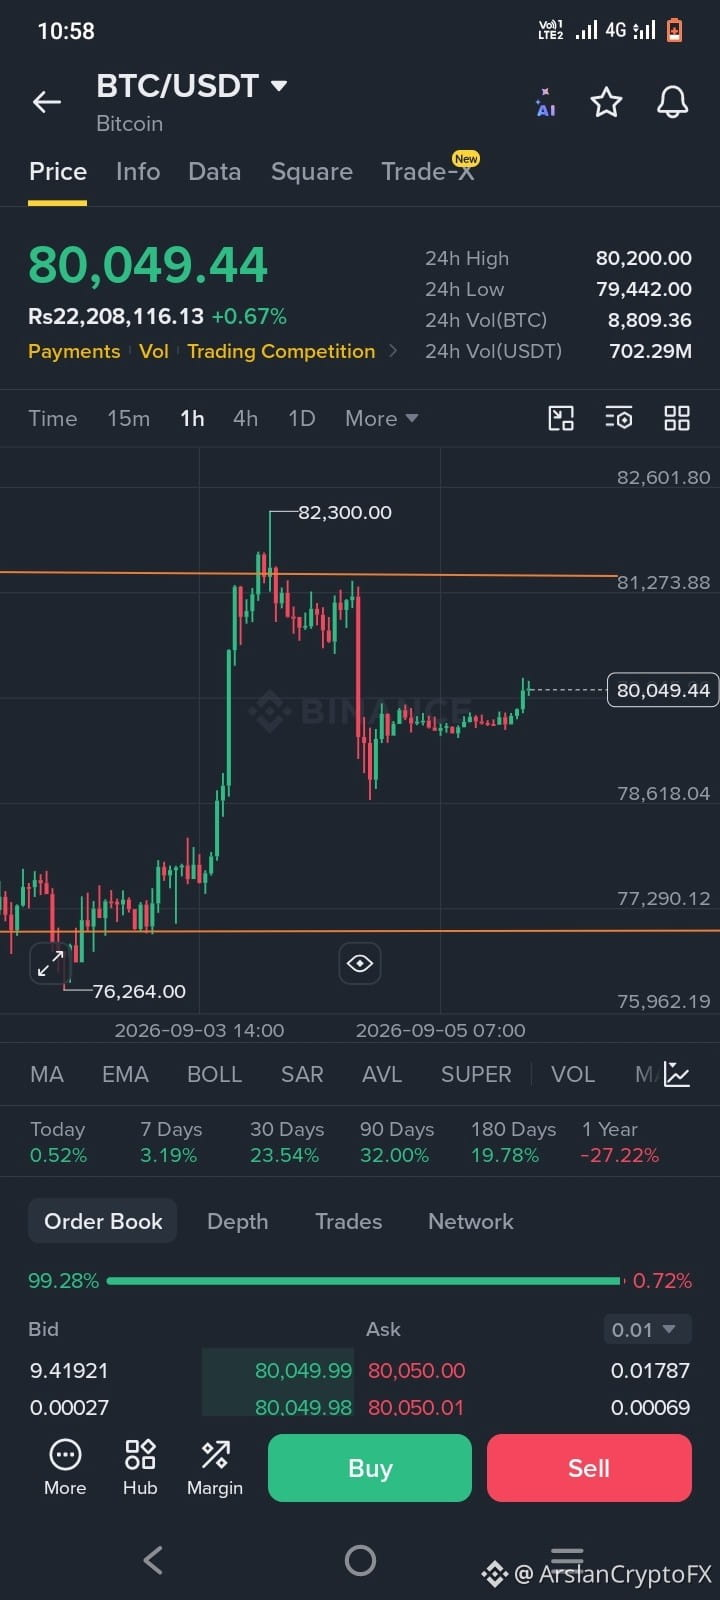
Bitcoin ($BTC ) 1-Hour timeframe par $80,000 ke psychological level ko regain karke $80,036.90 par trade kar raha hai, jab ke historical monthly performance bhi interesting indicators dikha rahi hai!
Key Technical Levels (1H Chart):
📍 Major Resistance Zone: $80,757 – $82,276 (Is resistance level ko breakout karke hold karna agle leg-up ke liye critical hai).
🎯 Next Target Zone: $82,500 – $84,000.
📉 Key Support Levels: $79,237 – $76,199 (Major local support zone).
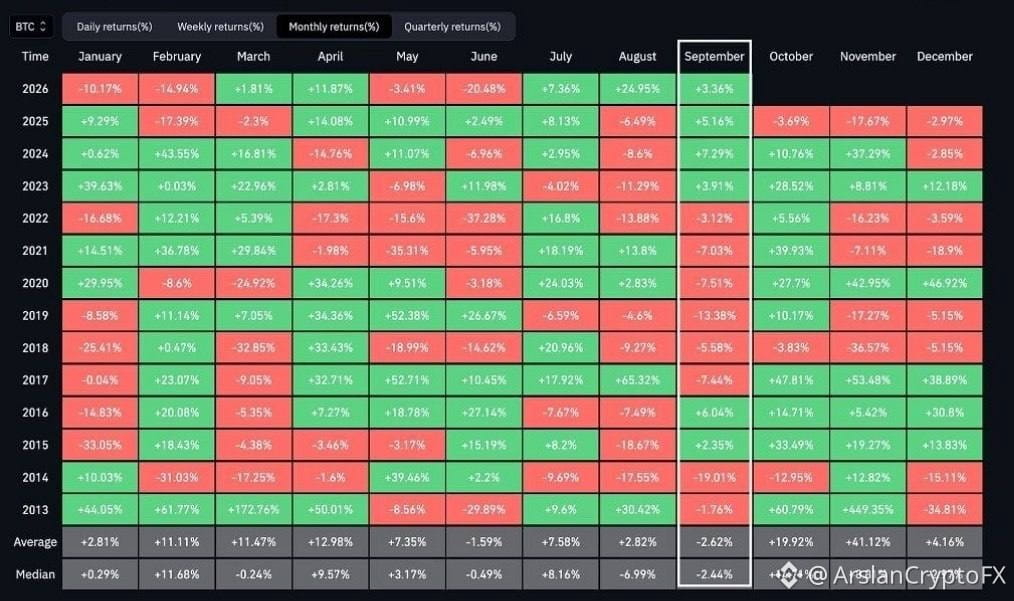
Monthly Performance Insights (Historical Heatmap):
📅 September Returns Trend: Historically, September BTC ke liye red month raha hai (Average: -2.62%), lekin 2023 (+3.91%), 2024 (+7.29%), 2025 (+5.16%) aur 2026 (+3.36%) mein bullish momentum maintain hua hai.
📈 Q4 Outlook: September ke baad October (Average: +19.92%) aur November (Average: +41.12%) historically Bitcoin ke sab se strong months rahe hain!
💡 Trading Strategy:
Agar BTC $80,757 ke resistance ko break karke hourly candle close karta hai, short-term target $82,200+ ho sakta hai. Dip milne par $79,200 zone strong re-entry support ka kaam kar sakta hai.
Always use proper Risk Management & Stop Loss! 🛡
#Bitcoin #BTC #CryptoAnalysis #TechnicalAnalysis #BinanceSquare #ZECHitsANewAllTimeHigh #LululemonTumbles20%OnWeakGuidance #BitcoinETFsBiggestDailyInflowSinceJanuary #USAugustJobGrowthNearlyTriplesForecast $BTC $ETH
Bitcoin ($BTC ) 1-Hour timeframe par $80,000 ke psychological level ko regain karke $80,036.90 par trade kar raha hai, jab ke historical monthly performance bhi interesting indicators dikha rahi hai!
Key Technical Levels (1H Chart):
📍 Major Resistance Zone: $80,757 – $82,276 (Is resistance level ko breakout karke hold karna agle leg-up ke liye critical hai).
🎯 Next Target Zone: $82,500 – $84,000.
📉 Key Support Levels: $79,237 – $76,199 (Major local support zone).
Monthly Performance Insights (Historical Heatmap):
📅 September Returns Trend: Historically, September BTC ke liye red month raha hai (Average: -2.62%), lekin 2023 (+3.91%), 2024 (+7.29%), 2025 (+5.16%) aur 2026 (+3.36%) mein bullish momentum maintain hua hai.
📈 Q4 Outlook: September ke baad October (Average: +19.92%) aur November (Average: +41.12%) historically Bitcoin ke sab se strong months rahe hain!
💡 Trading Strategy:
Agar BTC $80,757 ke resistance ko break karke hourly candle close karta hai, short-term target $82,200+ ho sakta hai. Dip milne par $79,200 zone strong re-entry support ka kaam kar sakta hai.
Always use proper Risk Management & Stop Loss! 🛡
#Bitcoin #BTC #CryptoAnalysis #TechnicalAnalysis #BinanceSquare #ZECHitsANewAllTimeHigh #LululemonTumbles20%OnWeakGuidance #BitcoinETFsBiggestDailyInflowSinceJanuary #USAugustJobGrowthNearlyTriplesForecast $BTC $ETH