
ZeroBlock
4.8k Публикации

ZeroBlock
Отправить жалобу
Заблокировать пользователя
BTC LOVER GOLD TRADER , SQUARE CRATOR
Открытая сделка
Трейдер с регулярными сделками
1.2 г
238 подписок(и/а)
25.2K+ подписчиков(а)
13.0K+ понравилось
Посты
Портфель
Все
Видео
Активно
·
--

Статья
Treasury Yields Are Becoming A Bigger Problem For CryptoThe Bitcoin weakness over the last day makes more sense when I look at what is happening in the Treasury market.
The 10 year Treasury yield has climbed toward 4.85 percent even after the U.S. Treasury announced a $6 billion buyback of longer dated Treasuries.
That caught my attention.
A buyback is normally expected to support bond prices and reduce yields. Yet the yield moved higher instead.
For me the important signal is not the $6 billion number.
It is the fact that the bond market is still showing strong selling pressure despite that intervention.
And this matters for crypto.
When Treasury yields rise investors have a stronger alternative for capital. Higher yields can also increase borrowing costs and make investors less comfortable taking risk.
Crypto usually feels that pressure quickly.
The timing is also important because the FOMC is approaching while markets are increasingly focused on the possibility of another rate hike. The probability is around 60 percent based on current pricing.
Then there are other pressures in the background.
Oil prices are rising because of geopolitical tensions. The U.S. government deficit is approaching $2 trillion while annual interest expenses are around $1.2 trillion.
None of these factors alone guarantees a crypto sell off.
But together they create a much tighter financial environment.
This is why I am watching the 10 year yield more closely than usual.
If yields stabilize around current levels then crypto could potentially absorb the pressure.
But if the yield pushes through 5 percent then the market could face another risk reduction phase as capital becomes more expensive and investors become more selective.
Bitcoin is already sitting inside an important $76K to $82K range.
So the macro setup is arriving at an interesting time.
A break above $80K would show buyers are still willing to take risk despite higher yields.
A move below $76K would tell me the macro pressure is starting to reach the price structure.
For now I would not treat the Treasury buyback as a bullish signal by itself.
The bond market reaction matters more than the size of the intervention.
If yields keep climbing even while policymakers try to ease pressure then crypto traders may have a much bigger problem to deal with this month.
Treasury Yields Are Becoming A Bigger Problem For Crypto
The Bitcoin weakness over the last day makes more sense when I look at what is happening in the Treasury market.
The 10 year Treasury yield has climbed toward 4.85 percent even after the U.S. Treasury announced a $6 billion buyback of longer dated Treasuries.
That caught my attention.
A buyback is normally expected to support bond prices and reduce yields. Yet the yield moved higher instead.
For me the important signal is not the $6 billion number.
It is the fact that the bond market is still showing strong selling pressure despite that intervention.
And this matters for crypto.
When Treasury yields rise investors have a stronger alternative for capital. Higher yields can also increase borrowing costs and make investors less comfortable taking risk.
Crypto usually feels that pressure quickly.
The timing is also important because the FOMC is approaching while markets are increasingly focused on the possibility of another rate hike. The probability is around 60 percent based on current pricing.
Then there are other pressures in the background.
Oil prices are rising because of geopolitical tensions. The U.S. government deficit is approaching $2 trillion while annual interest expenses are around $1.2 trillion.
None of these factors alone guarantees a crypto sell off.
But together they create a much tighter financial environment.
This is why I am watching the 10 year yield more closely than usual.
If yields stabilize around current levels then crypto could potentially absorb the pressure.
But if the yield pushes through 5 percent then the market could face another risk reduction phase as capital becomes more expensive and investors become more selective.
Bitcoin is already sitting inside an important $76K to $82K range.
So the macro setup is arriving at an interesting time.
A break above $80K would show buyers are still willing to take risk despite higher yields.
A move below $76K would tell me the macro pressure is starting to reach the price structure.
For now I would not treat the Treasury buyback as a bullish signal by itself.
The bond market reaction matters more than the size of the intervention.
If yields keep climbing even while policymakers try to ease pressure then crypto traders may have a much bigger problem to deal with this month.
The 10 year Treasury yield has climbed toward 4.85 percent even after the U.S. Treasury announced a $6 billion buyback of longer dated Treasuries.
That caught my attention.
A buyback is normally expected to support bond prices and reduce yields. Yet the yield moved higher instead.
For me the important signal is not the $6 billion number.
It is the fact that the bond market is still showing strong selling pressure despite that intervention.
And this matters for crypto.
When Treasury yields rise investors have a stronger alternative for capital. Higher yields can also increase borrowing costs and make investors less comfortable taking risk.
Crypto usually feels that pressure quickly.
The timing is also important because the FOMC is approaching while markets are increasingly focused on the possibility of another rate hike. The probability is around 60 percent based on current pricing.
Then there are other pressures in the background.
Oil prices are rising because of geopolitical tensions. The U.S. government deficit is approaching $2 trillion while annual interest expenses are around $1.2 trillion.
None of these factors alone guarantees a crypto sell off.
But together they create a much tighter financial environment.
This is why I am watching the 10 year yield more closely than usual.
If yields stabilize around current levels then crypto could potentially absorb the pressure.
But if the yield pushes through 5 percent then the market could face another risk reduction phase as capital becomes more expensive and investors become more selective.
Bitcoin is already sitting inside an important $76K to $82K range.
So the macro setup is arriving at an interesting time.
A break above $80K would show buyers are still willing to take risk despite higher yields.
A move below $76K would tell me the macro pressure is starting to reach the price structure.
For now I would not treat the Treasury buyback as a bullish signal by itself.
The bond market reaction matters more than the size of the intervention.
If yields keep climbing even while policymakers try to ease pressure then crypto traders may have a much bigger problem to deal with this month.
1
174
·
--

Статья
LAPTOP Did Not Just Crash The Liquidity Was The Real ProblemLAPTOP went from above $300 to below $1 in minutes.
A 98 percent collapse like that looks like a simple meme coin disaster at first. But the deeper issue for me is not just the sniper bots being blamed for the move.
It is the liquidity they were operating against.
The token launched around $0.05 and quickly attracted heavy early activity. Price briefly exploded above $300 before liquidity disappeared and the market fell toward $4.36. It later traded near $0.75.
That kind of move tells me the initial price was never supported by deep enough liquidity.
Bubblemaps data makes the damage even clearer.
More than 15K wallets participated. Around 11.3K wallets lost less than $1K while only 363 wallets made more than $1K.
Ten wallets reportedly made more than $100K.
That is a very different distribution of outcomes.
Early sellers had access to liquidity while later buyers were left holding positions after the market repriced violently.
Then there is another detail I would not ignore.
A Wintermute tagged wallet received 2.5 million LAPTOP from the project team and later sold 466K tokens for around $2.08M.
That does not prove the wallet caused the crash.
The timing matters though.
When liquidity is thin even a relatively large sale can create extreme slippage and push the price much further than traders expect.
The foundation has blamed sniper bots for overwhelming limited liquidity and plans to add 4 million tokens to Aerodrome pools. It also plans to reduce supply by 1 percent within a week.
More liquidity can certainly help.
But I think the bigger question is whether deeper liquidity arrives before confidence disappears.
A token can have a huge launch volume and thousands of wallets while still having a very fragile market.
That is what LAPTOP seems to have exposed.
The lesson here is not simply that sniper bots are dangerous.
The more important lesson is that liquidity design decides how much damage those bots can actually create.
If the pools remain shallow then another wave of buying or selling can produce another extreme move.
Until liquidity becomes deeper and trading becomes calmer I would treat LAPTOP as a highly speculative market rather than assuming the new liquidity plan automatically fixes the problem.
LAPTOP Did Not Just Crash The Liquidity Was The Real Problem
LAPTOP went from above $300 to below $1 in minutes.
A 98 percent collapse like that looks like a simple meme coin disaster at first. But the deeper issue for me is not just the sniper bots being blamed for the move.
It is the liquidity they were operating against.
The token launched around $0.05 and quickly attracted heavy early activity. Price briefly exploded above $300 before liquidity disappeared and the market fell toward $4.36. It later traded near $0.75.
That kind of move tells me the initial price was never supported by deep enough liquidity.
Bubblemaps data makes the damage even clearer.
More than 15K wallets participated. Around 11.3K wallets lost less than $1K while only 363 wallets made more than $1K.
Ten wallets reportedly made more than $100K.
That is a very different distribution of outcomes.
Early sellers had access to liquidity while later buyers were left holding positions after the market repriced violently.
Then there is another detail I would not ignore.
A Wintermute tagged wallet received 2.5 million LAPTOP from the project team and later sold 466K tokens for around $2.08M.
That does not prove the wallet caused the crash.
The timing matters though.
When liquidity is thin even a relatively large sale can create extreme slippage and push the price much further than traders expect.
The foundation has blamed sniper bots for overwhelming limited liquidity and plans to add 4 million tokens to Aerodrome pools. It also plans to reduce supply by 1 percent within a week.
More liquidity can certainly help.
But I think the bigger question is whether deeper liquidity arrives before confidence disappears.
A token can have a huge launch volume and thousands of wallets while still having a very fragile market.
That is what LAPTOP seems to have exposed.
The lesson here is not simply that sniper bots are dangerous.
The more important lesson is that liquidity design decides how much damage those bots can actually create.
If the pools remain shallow then another wave of buying or selling can produce another extreme move.
Until liquidity becomes deeper and trading becomes calmer I would treat LAPTOP as a highly speculative market rather than assuming the new liquidity plan automatically fixes the problem.
A 98 percent collapse like that looks like a simple meme coin disaster at first. But the deeper issue for me is not just the sniper bots being blamed for the move.
It is the liquidity they were operating against.
The token launched around $0.05 and quickly attracted heavy early activity. Price briefly exploded above $300 before liquidity disappeared and the market fell toward $4.36. It later traded near $0.75.
That kind of move tells me the initial price was never supported by deep enough liquidity.
Bubblemaps data makes the damage even clearer.
More than 15K wallets participated. Around 11.3K wallets lost less than $1K while only 363 wallets made more than $1K.
Ten wallets reportedly made more than $100K.
That is a very different distribution of outcomes.
Early sellers had access to liquidity while later buyers were left holding positions after the market repriced violently.
Then there is another detail I would not ignore.
A Wintermute tagged wallet received 2.5 million LAPTOP from the project team and later sold 466K tokens for around $2.08M.
That does not prove the wallet caused the crash.
The timing matters though.
When liquidity is thin even a relatively large sale can create extreme slippage and push the price much further than traders expect.
The foundation has blamed sniper bots for overwhelming limited liquidity and plans to add 4 million tokens to Aerodrome pools. It also plans to reduce supply by 1 percent within a week.
More liquidity can certainly help.
But I think the bigger question is whether deeper liquidity arrives before confidence disappears.
A token can have a huge launch volume and thousands of wallets while still having a very fragile market.
That is what LAPTOP seems to have exposed.
The lesson here is not simply that sniper bots are dangerous.
The more important lesson is that liquidity design decides how much damage those bots can actually create.
If the pools remain shallow then another wave of buying or selling can produce another extreme move.
Until liquidity becomes deeper and trading becomes calmer I would treat LAPTOP as a highly speculative market rather than assuming the new liquidity plan automatically fixes the problem.
388
·
--

Статья
NEAR Is Finally Testing The $3 QuestionNEAR just pushed another 10 percent higher and this time I think the price move deserves more attention.
The interesting part is what happened before the rally.
NEAR pulled back toward $2.28 and buyers defended that area. Since then price has recovered and has now closed above the $2.50 local high.
That makes $2.50 much more important than the 10 percent daily candle.
If buyers can keep NEAR above this level then the next obvious area I would watch is $3.
But there is more happening underneath the chart.
NEAR holder revenue reached around $723K on September 9. That was a new monthly high and the positive trend has continued.
TVL has also climbed to around $198M.
For me the combination is more interesting than price alone.
A token can rally because traders are chasing momentum. But when network value and holder revenue are also moving higher it gives the market a stronger fundamental signal to work with.
Still I would not assume that $3 is guaranteed.
NEAR has already moved quickly from the $2.28 demand zone and momentum can cool after a move like this.
The key test is now $2.50.
If that level becomes support then the breakout has a better chance of extending toward $3.
If price falls back below $2.50 then I would not be surprised to see another test of $2.28.
That would actually tell me a lot.
Holding $2.28 again would show that buyers are still willing to defend the broader structure.
Losing it would tell a different story and could mean this breakout was mainly momentum rather than sustained demand.
Right now the setup looks constructive because price is above the important EMAs while TVL and holder revenue are also improving.
But I am watching the retest more than the target.
$3 is the next level everyone can see.
$2.50 is where the market has to prove it deserves to get there.
NEAR Is Finally Testing The $3 Question
NEAR just pushed another 10 percent higher and this time I think the price move deserves more attention.
The interesting part is what happened before the rally.
NEAR pulled back toward $2.28 and buyers defended that area. Since then price has recovered and has now closed above the $2.50 local high.
That makes $2.50 much more important than the 10 percent daily candle.
If buyers can keep NEAR above this level then the next obvious area I would watch is $3.
But there is more happening underneath the chart.
NEAR holder revenue reached around $723K on September 9. That was a new monthly high and the positive trend has continued.
TVL has also climbed to around $198M.
For me the combination is more interesting than price alone.
A token can rally because traders are chasing momentum. But when network value and holder revenue are also moving higher it gives the market a stronger fundamental signal to work with.
Still I would not assume that $3 is guaranteed.
NEAR has already moved quickly from the $2.28 demand zone and momentum can cool after a move like this.
The key test is now $2.50.
If that level becomes support then the breakout has a better chance of extending toward $3.
If price falls back below $2.50 then I would not be surprised to see another test of $2.28.
That would actually tell me a lot.
Holding $2.28 again would show that buyers are still willing to defend the broader structure.
Losing it would tell a different story and could mean this breakout was mainly momentum rather than sustained demand.
Right now the setup looks constructive because price is above the important EMAs while TVL and holder revenue are also improving.
But I am watching the retest more than the target.
$3 is the next level everyone can see.
$2.50 is where the market has to prove it deserves to get there.
The interesting part is what happened before the rally.
NEAR pulled back toward $2.28 and buyers defended that area. Since then price has recovered and has now closed above the $2.50 local high.
That makes $2.50 much more important than the 10 percent daily candle.
If buyers can keep NEAR above this level then the next obvious area I would watch is $3.
But there is more happening underneath the chart.
NEAR holder revenue reached around $723K on September 9. That was a new monthly high and the positive trend has continued.
TVL has also climbed to around $198M.
For me the combination is more interesting than price alone.
A token can rally because traders are chasing momentum. But when network value and holder revenue are also moving higher it gives the market a stronger fundamental signal to work with.
Still I would not assume that $3 is guaranteed.
NEAR has already moved quickly from the $2.28 demand zone and momentum can cool after a move like this.
The key test is now $2.50.
If that level becomes support then the breakout has a better chance of extending toward $3.
If price falls back below $2.50 then I would not be surprised to see another test of $2.28.
That would actually tell me a lot.
Holding $2.28 again would show that buyers are still willing to defend the broader structure.
Losing it would tell a different story and could mean this breakout was mainly momentum rather than sustained demand.
Right now the setup looks constructive because price is above the important EMAs while TVL and holder revenue are also improving.
But I am watching the retest more than the target.
$3 is the next level everyone can see.
$2.50 is where the market has to prove it deserves to get there.
131
·
--

Статья
Why Crypto Is Falling TodayBitcoin pushed toward $79.8K before giving back the move and dropping to around $77.8K.
At first this looks like another normal BTC rejection. But the reason behind the move is more interesting because several pressures are hitting the market at the same time.
The biggest immediate effect came from leverage.
Around $386M in crypto positions were liquidated in one day. Bitcoin alone saw roughly $270M in long liquidations compared with around $117M in shorts.
That tells me the market was still carrying plenty of bullish leverage when BTC started falling.
Once $79K started failing those long positions became forced sellers and added more pressure to the decline.
ETF demand is also not helping right now.
Spot Bitcoin ETFs recorded around $166.8M in combined outflows across the previous two trading sessions. At the same time long term holders have been taking some profit.
So Bitcoin is dealing with weaker fresh demand while existing holders are willing to sell into strength.
Then there is the macro side.
Higher oil prices are creating fresh inflation concerns. Markets are also increasingly pricing the possibility of a Federal Reserve rate hike with the probability reaching around 60.2%.
This matters because crypto liquidity is highly sensitive to expectations around interest rates.
Still I would not call the Bitcoin structure bearish yet.
The $76K to $82K area remains the major battleground. A large portion of BTC supply was accumulated around this region and buyers have already defended the lower side several times.
The immediate level I am watching is around $77.4K.
That area has a large liquidation cluster and Bitcoin could easily sweep it before deciding the next direction.
If buyers recover $79.7K and then reclaim $80.5K the pressure could start easing.
But losing $76K would change the picture for me.
That would put the short term structure at risk and could open the door toward lower support around the mid $70K area.
So I am not looking at today's drop as simply a reason to panic.
The market is dealing with leverage liquidation plus weaker ETF demand plus profit taking plus rising rate concerns.
The real test is whether Bitcoin can hold the $76K to $77K demand zone after that leverage has been cleared.
If it does then this could turn into another reset.
If it does not then the market may need much more time to rebuild demand.
Why Crypto Is Falling Today
Bitcoin pushed toward $79.8K before giving back the move and dropping to around $77.8K.
At first this looks like another normal BTC rejection. But the reason behind the move is more interesting because several pressures are hitting the market at the same time.
The biggest immediate effect came from leverage.
Around $386M in crypto positions were liquidated in one day. Bitcoin alone saw roughly $270M in long liquidations compared with around $117M in shorts.
That tells me the market was still carrying plenty of bullish leverage when BTC started falling.
Once $79K started failing those long positions became forced sellers and added more pressure to the decline.
ETF demand is also not helping right now.
Spot Bitcoin ETFs recorded around $166.8M in combined outflows across the previous two trading sessions. At the same time long term holders have been taking some profit.
So Bitcoin is dealing with weaker fresh demand while existing holders are willing to sell into strength.
Then there is the macro side.
Higher oil prices are creating fresh inflation concerns. Markets are also increasingly pricing the possibility of a Federal Reserve rate hike with the probability reaching around 60.2%.
This matters because crypto liquidity is highly sensitive to expectations around interest rates.
Still I would not call the Bitcoin structure bearish yet.
The $76K to $82K area remains the major battleground. A large portion of BTC supply was accumulated around this region and buyers have already defended the lower side several times.
The immediate level I am watching is around $77.4K.
That area has a large liquidation cluster and Bitcoin could easily sweep it before deciding the next direction.
If buyers recover $79.7K and then reclaim $80.5K the pressure could start easing.
But losing $76K would change the picture for me.
That would put the short term structure at risk and could open the door toward lower support around the mid $70K area.
So I am not looking at today's drop as simply a reason to panic.
The market is dealing with leverage liquidation plus weaker ETF demand plus profit taking plus rising rate concerns.
The real test is whether Bitcoin can hold the $76K to $77K demand zone after that leverage has been cleared.
If it does then this could turn into another reset.
If it does not then the market may need much more time to rebuild demand.
At first this looks like another normal BTC rejection. But the reason behind the move is more interesting because several pressures are hitting the market at the same time.
The biggest immediate effect came from leverage.
Around $386M in crypto positions were liquidated in one day. Bitcoin alone saw roughly $270M in long liquidations compared with around $117M in shorts.
That tells me the market was still carrying plenty of bullish leverage when BTC started falling.
Once $79K started failing those long positions became forced sellers and added more pressure to the decline.
ETF demand is also not helping right now.
Spot Bitcoin ETFs recorded around $166.8M in combined outflows across the previous two trading sessions. At the same time long term holders have been taking some profit.
So Bitcoin is dealing with weaker fresh demand while existing holders are willing to sell into strength.
Then there is the macro side.
Higher oil prices are creating fresh inflation concerns. Markets are also increasingly pricing the possibility of a Federal Reserve rate hike with the probability reaching around 60.2%.
This matters because crypto liquidity is highly sensitive to expectations around interest rates.
Still I would not call the Bitcoin structure bearish yet.
The $76K to $82K area remains the major battleground. A large portion of BTC supply was accumulated around this region and buyers have already defended the lower side several times.
The immediate level I am watching is around $77.4K.
That area has a large liquidation cluster and Bitcoin could easily sweep it before deciding the next direction.
If buyers recover $79.7K and then reclaim $80.5K the pressure could start easing.
But losing $76K would change the picture for me.
That would put the short term structure at risk and could open the door toward lower support around the mid $70K area.
So I am not looking at today's drop as simply a reason to panic.
The market is dealing with leverage liquidation plus weaker ETF demand plus profit taking plus rising rate concerns.
The real test is whether Bitcoin can hold the $76K to $77K demand zone after that leverage has been cleared.
If it does then this could turn into another reset.
If it does not then the market may need much more time to rebuild demand.
1
108
·
--

Статья
FF Is Up 25 Percent But The Rally Is Getting StretchedFalcon Finance just made a move that is hard to ignore.
FF jumped around 25 percent in 24 hours and reached roughly $0.159. The bigger surprise for me was the trading activity behind it. Volume exploded more than 1200 percent and reached around $111 million while market cap moved above $465 million.
But the part I keep watching is what happens after a move like this.
FF reclaimed $0.10 about a week ago and has continued pushing higher. Protocol USD inflows also reached a monthly high above $1 million.
That suggests there is real activity behind the move rather than price moving completely on thin liquidity.
The derivatives market is getting aggressive too.
Open Interest increased around 35 percent to $175 million while derivatives volume jumped 468 percent to around $172 million.
When both OI and volume rise this quickly it tells me traders are willing to take more risk.
That can help a rally continue.
It can also make the correction much sharper if the market turns.
There is already one warning signal.
Sell volume has been higher than buy volume for seven straight days. Over the last 24 hours sellers accounted for around $66.7 million while buying volume was around $64 million.
So profit taking is already happening even while price keeps moving higher.
The RSI is another reason I would not chase this candle.
It has reached around 84 which is clearly overbought. Aroon Up is also at 100 percent showing how strong the current trend has become.
For me the interesting battle is now between fresh capital and profit taking.
If inflows continue and buyers can absorb the selling then FF could eventually test the $0.20 area.
But if leveraged traders start closing positions and spot sellers become more aggressive then the first level I would watch is $0.11.
That level matters because FF already showed it could attract buyers there.
The 25 percent rally is impressive.
But after such a fast move I care less about how high FF can go next and more about whether buyers can defend the previous breakout.
A strong trend does not mean price moves straight up.
Sometimes the healthiest test comes after everyone starts believing it will.
FF Is Up 25 Percent But The Rally Is Getting Stretched
Falcon Finance just made a move that is hard to ignore.
FF jumped around 25 percent in 24 hours and reached roughly $0.159. The bigger surprise for me was the trading activity behind it. Volume exploded more than 1200 percent and reached around $111 million while market cap moved above $465 million.
But the part I keep watching is what happens after a move like this.
FF reclaimed $0.10 about a week ago and has continued pushing higher. Protocol USD inflows also reached a monthly high above $1 million.
That suggests there is real activity behind the move rather than price moving completely on thin liquidity.
The derivatives market is getting aggressive too.
Open Interest increased around 35 percent to $175 million while derivatives volume jumped 468 percent to around $172 million.
When both OI and volume rise this quickly it tells me traders are willing to take more risk.
That can help a rally continue.
It can also make the correction much sharper if the market turns.
There is already one warning signal.
Sell volume has been higher than buy volume for seven straight days. Over the last 24 hours sellers accounted for around $66.7 million while buying volume was around $64 million.
So profit taking is already happening even while price keeps moving higher.
The RSI is another reason I would not chase this candle.
It has reached around 84 which is clearly overbought. Aroon Up is also at 100 percent showing how strong the current trend has become.
For me the interesting battle is now between fresh capital and profit taking.
If inflows continue and buyers can absorb the selling then FF could eventually test the $0.20 area.
But if leveraged traders start closing positions and spot sellers become more aggressive then the first level I would watch is $0.11.
That level matters because FF already showed it could attract buyers there.
The 25 percent rally is impressive.
But after such a fast move I care less about how high FF can go next and more about whether buyers can defend the previous breakout.
A strong trend does not mean price moves straight up.
Sometimes the healthiest test comes after everyone starts believing it will.
FF jumped around 25 percent in 24 hours and reached roughly $0.159. The bigger surprise for me was the trading activity behind it. Volume exploded more than 1200 percent and reached around $111 million while market cap moved above $465 million.
But the part I keep watching is what happens after a move like this.
FF reclaimed $0.10 about a week ago and has continued pushing higher. Protocol USD inflows also reached a monthly high above $1 million.
That suggests there is real activity behind the move rather than price moving completely on thin liquidity.
The derivatives market is getting aggressive too.
Open Interest increased around 35 percent to $175 million while derivatives volume jumped 468 percent to around $172 million.
When both OI and volume rise this quickly it tells me traders are willing to take more risk.
That can help a rally continue.
It can also make the correction much sharper if the market turns.
There is already one warning signal.
Sell volume has been higher than buy volume for seven straight days. Over the last 24 hours sellers accounted for around $66.7 million while buying volume was around $64 million.
So profit taking is already happening even while price keeps moving higher.
The RSI is another reason I would not chase this candle.
It has reached around 84 which is clearly overbought. Aroon Up is also at 100 percent showing how strong the current trend has become.
For me the interesting battle is now between fresh capital and profit taking.
If inflows continue and buyers can absorb the selling then FF could eventually test the $0.20 area.
But if leveraged traders start closing positions and spot sellers become more aggressive then the first level I would watch is $0.11.
That level matters because FF already showed it could attract buyers there.
The 25 percent rally is impressive.
But after such a fast move I care less about how high FF can go next and more about whether buyers can defend the previous breakout.
A strong trend does not mean price moves straight up.
Sometimes the healthiest test comes after everyone starts believing it will.
254
·
--

Статья
FORM Is Up 14 Percent But Sellers Are Already Showing UpFORM has gained around 14 percent over the past week and the chart looks strong at first glance.
But when I looked at the trading activity underneath the move I found a setup that deserves more attention.
Across the perpetual market sellers are currently controlling around 53 percent of the volume. Total perpetual volume is around $329 million with roughly $174.6 million coming from sellers.
That is not automatically bearish.
But it tells me the rally is facing real resistance from traders who are willing to sell into the strength.
Another detail caught my attention.
The recent price move appears to have been driven more by retail traders while whale activity has remained relatively steady. The Whale Retail Delta is still positive around 0.39 but the recent decline suggests retail traders have been taking more control of the move.
This is where I become cautious.
Retail driven rallies can continue for longer than expected. But they can also reverse quickly when momentum slows and traders start closing positions at the same time.
The spot market is giving a completely different signal though.
Around $15.65 million worth of FORM has been bought recently. Spot netflow is around minus $1.14 million which points toward continued accumulation.
For me this is the most important part of the setup.
Perpetual traders are showing stronger selling pressure while spot buyers are still absorbing supply.
So the question is not whether FORM is bullish right now.
The real question is which side eventually wins.
If spot accumulation continues while sellers keep attacking the perpetual market then the selling pressure could eventually get absorbed.
But if spot buying starts weakening while retail traders begin taking profit then the current 14 percent gain could unwind much faster than expected.
I would not chase FORM simply because the weekly chart looks strong.
I would watch the spot flow first.
Strong spot buying can support the move.
Weakening spot demand combined with heavy perpetual selling would be a very different signal.
Right now FORM is showing strength on the chart but the market underneath is already arguing with that strength.
FORM Is Up 14 Percent But Sellers Are Already Showing Up
FORM has gained around 14 percent over the past week and the chart looks strong at first glance.
But when I looked at the trading activity underneath the move I found a setup that deserves more attention.
Across the perpetual market sellers are currently controlling around 53 percent of the volume. Total perpetual volume is around $329 million with roughly $174.6 million coming from sellers.
That is not automatically bearish.
But it tells me the rally is facing real resistance from traders who are willing to sell into the strength.
Another detail caught my attention.
The recent price move appears to have been driven more by retail traders while whale activity has remained relatively steady. The Whale Retail Delta is still positive around 0.39 but the recent decline suggests retail traders have been taking more control of the move.
This is where I become cautious.
Retail driven rallies can continue for longer than expected. But they can also reverse quickly when momentum slows and traders start closing positions at the same time.
The spot market is giving a completely different signal though.
Around $15.65 million worth of FORM has been bought recently. Spot netflow is around minus $1.14 million which points toward continued accumulation.
For me this is the most important part of the setup.
Perpetual traders are showing stronger selling pressure while spot buyers are still absorbing supply.
So the question is not whether FORM is bullish right now.
The real question is which side eventually wins.
If spot accumulation continues while sellers keep attacking the perpetual market then the selling pressure could eventually get absorbed.
But if spot buying starts weakening while retail traders begin taking profit then the current 14 percent gain could unwind much faster than expected.
I would not chase FORM simply because the weekly chart looks strong.
I would watch the spot flow first.
Strong spot buying can support the move.
Weakening spot demand combined with heavy perpetual selling would be a very different signal.
Right now FORM is showing strength on the chart but the market underneath is already arguing with that strength.
But when I looked at the trading activity underneath the move I found a setup that deserves more attention.
Across the perpetual market sellers are currently controlling around 53 percent of the volume. Total perpetual volume is around $329 million with roughly $174.6 million coming from sellers.
That is not automatically bearish.
But it tells me the rally is facing real resistance from traders who are willing to sell into the strength.
Another detail caught my attention.
The recent price move appears to have been driven more by retail traders while whale activity has remained relatively steady. The Whale Retail Delta is still positive around 0.39 but the recent decline suggests retail traders have been taking more control of the move.
This is where I become cautious.
Retail driven rallies can continue for longer than expected. But they can also reverse quickly when momentum slows and traders start closing positions at the same time.
The spot market is giving a completely different signal though.
Around $15.65 million worth of FORM has been bought recently. Spot netflow is around minus $1.14 million which points toward continued accumulation.
For me this is the most important part of the setup.
Perpetual traders are showing stronger selling pressure while spot buyers are still absorbing supply.
So the question is not whether FORM is bullish right now.
The real question is which side eventually wins.
If spot accumulation continues while sellers keep attacking the perpetual market then the selling pressure could eventually get absorbed.
But if spot buying starts weakening while retail traders begin taking profit then the current 14 percent gain could unwind much faster than expected.
I would not chase FORM simply because the weekly chart looks strong.
I would watch the spot flow first.
Strong spot buying can support the move.
Weakening spot demand combined with heavy perpetual selling would be a very different signal.
Right now FORM is showing strength on the chart but the market underneath is already arguing with that strength.
347
·
--

Статья
NEAR Is Showing The Infrastructure Behind The MoveNEAR just moved more than 11 percent and at first I thought this was simply another altcoin bounce.
Then I looked at what is happening underneath the token.
NEAR Intents has now crossed $27 billion in volume across 34 chains. That number caught my attention because this is not just a new feature waiting for users. Other platforms are already building around the infrastructure.
Ledger and Brave are connected to it. Infinex and LI.FI are also using the system. ZEC can move toward Solana through NEAR Intents while private trading infrastructure is also using the same type of cross chain rail.
That changes how I look at the story.
The interesting part is not necessarily that NEAR Intents crossed $27 billion. It is that NEAR is becoming part of the background infrastructure that users may interact with without even thinking about which chain is being used.
Now look at the token.
NEAR moved from around $2.32 to $2.59. RSI reached around 74 which puts it into overbought territory.
That makes me cautious.
The last time RSI reached similar levels during the May and June rally the move eventually lost momentum. This time the MACD is still supporting the trend and the histogram is expanding.
The derivatives market is also getting more active.
Aggregated Open Interest reached around $458 million and has been rising since the beginning of September. Funding has remained positive and recently sat around 0.0117.
So traders are clearly participating in the move and many are still comfortable holding long positions.
But this is exactly where I would avoid assuming that rising Intents volume automatically means NEAR must keep going higher.
The $27 billion milestone strengthens the ecosystem story. It does not guarantee token demand.
For me the next test is whether NEAR can hold the recent breakout while leverage remains elevated.
If buyers defend the new range then the infrastructure growth starts looking more important than the 11 percent candle.
If price loses momentum while funding and OI remain crowded then this rally could become another leverage driven move.
The infrastructure is growing.
Now I want to see whether the token can actually catch up sustainably.
NEAR Is Showing The Infrastructure Behind The Move
NEAR just moved more than 11 percent and at first I thought this was simply another altcoin bounce.
Then I looked at what is happening underneath the token.
NEAR Intents has now crossed $27 billion in volume across 34 chains. That number caught my attention because this is not just a new feature waiting for users. Other platforms are already building around the infrastructure.
Ledger and Brave are connected to it. Infinex and LI.FI are also using the system. ZEC can move toward Solana through NEAR Intents while private trading infrastructure is also using the same type of cross chain rail.
That changes how I look at the story.
The interesting part is not necessarily that NEAR Intents crossed $27 billion. It is that NEAR is becoming part of the background infrastructure that users may interact with without even thinking about which chain is being used.
Now look at the token.
NEAR moved from around $2.32 to $2.59. RSI reached around 74 which puts it into overbought territory.
That makes me cautious.
The last time RSI reached similar levels during the May and June rally the move eventually lost momentum. This time the MACD is still supporting the trend and the histogram is expanding.
The derivatives market is also getting more active.
Aggregated Open Interest reached around $458 million and has been rising since the beginning of September. Funding has remained positive and recently sat around 0.0117.
So traders are clearly participating in the move and many are still comfortable holding long positions.
But this is exactly where I would avoid assuming that rising Intents volume automatically means NEAR must keep going higher.
The $27 billion milestone strengthens the ecosystem story. It does not guarantee token demand.
For me the next test is whether NEAR can hold the recent breakout while leverage remains elevated.
If buyers defend the new range then the infrastructure growth starts looking more important than the 11 percent candle.
If price loses momentum while funding and OI remain crowded then this rally could become another leverage driven move.
The infrastructure is growing.
Now I want to see whether the token can actually catch up sustainably.
Then I looked at what is happening underneath the token.
NEAR Intents has now crossed $27 billion in volume across 34 chains. That number caught my attention because this is not just a new feature waiting for users. Other platforms are already building around the infrastructure.
Ledger and Brave are connected to it. Infinex and LI.FI are also using the system. ZEC can move toward Solana through NEAR Intents while private trading infrastructure is also using the same type of cross chain rail.
That changes how I look at the story.
The interesting part is not necessarily that NEAR Intents crossed $27 billion. It is that NEAR is becoming part of the background infrastructure that users may interact with without even thinking about which chain is being used.
Now look at the token.
NEAR moved from around $2.32 to $2.59. RSI reached around 74 which puts it into overbought territory.
That makes me cautious.
The last time RSI reached similar levels during the May and June rally the move eventually lost momentum. This time the MACD is still supporting the trend and the histogram is expanding.
The derivatives market is also getting more active.
Aggregated Open Interest reached around $458 million and has been rising since the beginning of September. Funding has remained positive and recently sat around 0.0117.
So traders are clearly participating in the move and many are still comfortable holding long positions.
But this is exactly where I would avoid assuming that rising Intents volume automatically means NEAR must keep going higher.
The $27 billion milestone strengthens the ecosystem story. It does not guarantee token demand.
For me the next test is whether NEAR can hold the recent breakout while leverage remains elevated.
If buyers defend the new range then the infrastructure growth starts looking more important than the 11 percent candle.
If price loses momentum while funding and OI remain crowded then this rally could become another leverage driven move.
The infrastructure is growing.
Now I want to see whether the token can actually catch up sustainably.
212
·
--

Статья
DOT Faces Its First Real TestPolkadot just moved 11 percent in 24 hours and the interesting part is not only the price move.
The dotUSD proposal has received around 97.5 percent governance approval. The plan includes a native decentralized stablecoin along with $5 million of initial liquidity for the DOT dotUSD pool on Asset Hub.
The treasury structure would provide $2.5 million in USDT for minting and another $2.5 million in DOT.
For me this is important because it gives DOT another possible use case inside its own ecosystem. Stablecoin liquidity can make an ecosystem easier to use. But a proposal getting strong approval does not automatically mean the market will keep buying DOT.
That is already becoming visible in the price action.
DOT pushed through the $0.946 and $1.044 resistance areas before reaching around $1.282. That level rejected the move and price quickly pulled back toward $1.192.
The derivatives data makes the rejection more interesting.
Futures taker activity turned seller dominant while around $305K in long positions were liquidated compared with only about $42K in shorts.
That tells me some traders were positioned for continuation and got caught when the breakout failed.
The technical structure is still not completely broken.
RSI dropped from around 85 to 76 after the rejection. That shows momentum is cooling but it is still elevated. MACD remains bullish and the positive histogram is still expanding.
So I would not call this a full trend reversal yet.
The level I am watching now is $1.044.
If DOT holds above $1.044 then this pullback could simply be a reset after a strong move. A successful retest could bring buyers back toward $1.282.
But if $1.044 fails then the next important area becomes $0.946.
The dotUSD catalyst gives DOT a fundamental story to work with. The derivatives market is showing that traders are already taking profit around resistance.
For me the next move matters more than the 11 percent rally.
DOT needs to prove that buyers can defend the breakout levels after the leverage gets flushed out.
DOT Faces Its First Real Test
Polkadot just moved 11 percent in 24 hours and the interesting part is not only the price move.
The dotUSD proposal has received around 97.5 percent governance approval. The plan includes a native decentralized stablecoin along with $5 million of initial liquidity for the DOT dotUSD pool on Asset Hub.
The treasury structure would provide $2.5 million in USDT for minting and another $2.5 million in DOT.
For me this is important because it gives DOT another possible use case inside its own ecosystem. Stablecoin liquidity can make an ecosystem easier to use. But a proposal getting strong approval does not automatically mean the market will keep buying DOT.
That is already becoming visible in the price action.
DOT pushed through the $0.946 and $1.044 resistance areas before reaching around $1.282. That level rejected the move and price quickly pulled back toward $1.192.
The derivatives data makes the rejection more interesting.
Futures taker activity turned seller dominant while around $305K in long positions were liquidated compared with only about $42K in shorts.
That tells me some traders were positioned for continuation and got caught when the breakout failed.
The technical structure is still not completely broken.
RSI dropped from around 85 to 76 after the rejection. That shows momentum is cooling but it is still elevated. MACD remains bullish and the positive histogram is still expanding.
So I would not call this a full trend reversal yet.
The level I am watching now is $1.044.
If DOT holds above $1.044 then this pullback could simply be a reset after a strong move. A successful retest could bring buyers back toward $1.282.
But if $1.044 fails then the next important area becomes $0.946.
The dotUSD catalyst gives DOT a fundamental story to work with. The derivatives market is showing that traders are already taking profit around resistance.
For me the next move matters more than the 11 percent rally.
DOT needs to prove that buyers can defend the breakout levels after the leverage gets flushed out.
The dotUSD proposal has received around 97.5 percent governance approval. The plan includes a native decentralized stablecoin along with $5 million of initial liquidity for the DOT dotUSD pool on Asset Hub.
The treasury structure would provide $2.5 million in USDT for minting and another $2.5 million in DOT.
For me this is important because it gives DOT another possible use case inside its own ecosystem. Stablecoin liquidity can make an ecosystem easier to use. But a proposal getting strong approval does not automatically mean the market will keep buying DOT.
That is already becoming visible in the price action.
DOT pushed through the $0.946 and $1.044 resistance areas before reaching around $1.282. That level rejected the move and price quickly pulled back toward $1.192.
The derivatives data makes the rejection more interesting.
Futures taker activity turned seller dominant while around $305K in long positions were liquidated compared with only about $42K in shorts.
That tells me some traders were positioned for continuation and got caught when the breakout failed.
The technical structure is still not completely broken.
RSI dropped from around 85 to 76 after the rejection. That shows momentum is cooling but it is still elevated. MACD remains bullish and the positive histogram is still expanding.
So I would not call this a full trend reversal yet.
The level I am watching now is $1.044.
If DOT holds above $1.044 then this pullback could simply be a reset after a strong move. A successful retest could bring buyers back toward $1.282.
But if $1.044 fails then the next important area becomes $0.946.
The dotUSD catalyst gives DOT a fundamental story to work with. The derivatives market is showing that traders are already taking profit around resistance.
For me the next move matters more than the 11 percent rally.
DOT needs to prove that buyers can defend the breakout levels after the leverage gets flushed out.
1
167
·
--

Статья
A SOL Whale Just Bought $28M And The Timing Is InterestingSolana is starting to look stronger again.
A whale reportedly accumulated 285503 SOL worth around $28M over the past three weeks.
For me the timing matters more than the size of the purchase.
Solana recently lost the top spot in daily DEX volume for a short period. But within roughly 72 hours it moved back above $2B in daily DEX volume.
That tells me the competition did not remove demand from the network.
The active address data also gives some context. Solana reportedly has around 10 times more active addresses than Robinhood Chain.
But DEX volume is not the only thing I am watching.
Solana is also becoming a major part of x402 activity. The network reportedly represents more than 80% of total activity.
That is interesting because x402 connects blockchain payments with AI agents and stablecoin transactions.
If that activity keeps growing then Solana's usage story becomes much broader than trading and memecoins.
The technical picture is also improving.
SOL recently closed its first green monthly candle in 10 months. Monthly MACD is getting close to a bullish crossover while the monthly RSI has broken above a two year downtrend.
None of this guarantees that SOL will continue higher.
But it does make the whale purchase more interesting.
If someone accumulates this much SOL while network activity is improving then it is possible that the buying is based on longer term conviction rather than a short term trade.
That is the part I would watch.
Whale accumulation alone does not create a bull market.
What matters is whether other demand follows.
If DEX activity stays above $2B per day and agentic transactions continue growing then the network has real activity supporting the price story.
If those numbers weaken then the whale purchase could simply become another isolated event.
For now I think the important change is that Solana is showing strength across several areas at the same time.
Network activity is recovering.
DEX volume is strong.
AI agent payments are growing.
Long term technical momentum is improving.
And large holders are accumulating.
That combination is much more interesting to me than a simple SOL price pump.
The next question is whether this $28M whale purchase is the beginning of a bigger accumulation phase or just one large bet.
The next few weeks should give us the answer.
A SOL Whale Just Bought $28M And The Timing Is Interesting
Solana is starting to look stronger again.
A whale reportedly accumulated 285503 SOL worth around $28M over the past three weeks.
For me the timing matters more than the size of the purchase.
Solana recently lost the top spot in daily DEX volume for a short period. But within roughly 72 hours it moved back above $2B in daily DEX volume.
That tells me the competition did not remove demand from the network.
The active address data also gives some context. Solana reportedly has around 10 times more active addresses than Robinhood Chain.
But DEX volume is not the only thing I am watching.
Solana is also becoming a major part of x402 activity. The network reportedly represents more than 80% of total activity.
That is interesting because x402 connects blockchain payments with AI agents and stablecoin transactions.
If that activity keeps growing then Solana's usage story becomes much broader than trading and memecoins.
The technical picture is also improving.
SOL recently closed its first green monthly candle in 10 months. Monthly MACD is getting close to a bullish crossover while the monthly RSI has broken above a two year downtrend.
None of this guarantees that SOL will continue higher.
But it does make the whale purchase more interesting.
If someone accumulates this much SOL while network activity is improving then it is possible that the buying is based on longer term conviction rather than a short term trade.
That is the part I would watch.
Whale accumulation alone does not create a bull market.
What matters is whether other demand follows.
If DEX activity stays above $2B per day and agentic transactions continue growing then the network has real activity supporting the price story.
If those numbers weaken then the whale purchase could simply become another isolated event.
For now I think the important change is that Solana is showing strength across several areas at the same time.
Network activity is recovering.
DEX volume is strong.
AI agent payments are growing.
Long term technical momentum is improving.
And large holders are accumulating.
That combination is much more interesting to me than a simple SOL price pump.
The next question is whether this $28M whale purchase is the beginning of a bigger accumulation phase or just one large bet.
The next few weeks should give us the answer.
A whale reportedly accumulated 285503 SOL worth around $28M over the past three weeks.
For me the timing matters more than the size of the purchase.
Solana recently lost the top spot in daily DEX volume for a short period. But within roughly 72 hours it moved back above $2B in daily DEX volume.
That tells me the competition did not remove demand from the network.
The active address data also gives some context. Solana reportedly has around 10 times more active addresses than Robinhood Chain.
But DEX volume is not the only thing I am watching.
Solana is also becoming a major part of x402 activity. The network reportedly represents more than 80% of total activity.
That is interesting because x402 connects blockchain payments with AI agents and stablecoin transactions.
If that activity keeps growing then Solana's usage story becomes much broader than trading and memecoins.
The technical picture is also improving.
SOL recently closed its first green monthly candle in 10 months. Monthly MACD is getting close to a bullish crossover while the monthly RSI has broken above a two year downtrend.
None of this guarantees that SOL will continue higher.
But it does make the whale purchase more interesting.
If someone accumulates this much SOL while network activity is improving then it is possible that the buying is based on longer term conviction rather than a short term trade.
That is the part I would watch.
Whale accumulation alone does not create a bull market.
What matters is whether other demand follows.
If DEX activity stays above $2B per day and agentic transactions continue growing then the network has real activity supporting the price story.
If those numbers weaken then the whale purchase could simply become another isolated event.
For now I think the important change is that Solana is showing strength across several areas at the same time.
Network activity is recovering.
DEX volume is strong.
AI agent payments are growing.
Long term technical momentum is improving.
And large holders are accumulating.
That combination is much more interesting to me than a simple SOL price pump.
The next question is whether this $28M whale purchase is the beginning of a bigger accumulation phase or just one large bet.
The next few weeks should give us the answer.
206
·
--

Статья
ZEC Shorts Are Getting Crowded But Buyers Are Still Holding The LineZcash is sitting in an interesting position right now.
ZEC is holding around $1,128 after recently pushing above $1,100. But the derivatives market is showing a very strong bearish view.
Around 72% of top trader accounts are holding shorts while only 28% are long.
That sounds bearish at first.
But the spot market is telling a different story.
The 90 day Spot Taker CVD remains buyer dominant. That means aggressive spot buyers are still absorbing available supply even while many traders are betting on a decline.
This is the part I would watch closely.
When shorts become crowded while spot buyers continue buying then the market can become vulnerable to another short squeeze.
There is already a good example of how risky this positioning can become.
One large ZEC short position entered around $576 while ZEC is now above $1,100. The position is reportedly sitting on a very large unrealized loss.
But I would not assume a squeeze is guaranteed.
The derivatives market is actually cooling down.
ZEC Open Interest fell around 11.5% to $2.41B while derivatives volume dropped more than 42% to around $5.99B.
That means the large short ratio is not necessarily showing a wave of fresh shorts entering the market.
Some traders may simply be reducing their positions after ZEC's huge move.
This makes the current setup more balanced than the 72% short figure suggests.
On the chart there is another level I find important.
ZEC failed to clear the $1,256 area and has started pulling back. The fair value gap below the current price extends toward around $1,024.
For me $1,024 is the key support zone.
If buyers defend this area and spot buying stays strong then ZEC could attempt another move toward $1,256.
A clean break above that level could put the crowded shorts under much more pressure.
But if $1,024 fails then the bullish setup becomes weaker and the market could need a deeper correction.
The MACD is still positive which gives the bulls some support.
So I would not focus only on the 72% short figure.
The more important question is whether spot buyers continue absorbing supply while leverage stays controlled.
If that happens then the bearish positioning could become fuel for another move higher.
If spot demand disappears then those shorts may finally get the move they are waiting for.
Right now ZEC is not a simple bullish or bearish setup.
It is a battle between persistent spot buying and a crowded bearish derivatives market.
ZEC Shorts Are Getting Crowded But Buyers Are Still Holding The Line
Zcash is sitting in an interesting position right now.
ZEC is holding around $1,128 after recently pushing above $1,100. But the derivatives market is showing a very strong bearish view.
Around 72% of top trader accounts are holding shorts while only 28% are long.
That sounds bearish at first.
But the spot market is telling a different story.
The 90 day Spot Taker CVD remains buyer dominant. That means aggressive spot buyers are still absorbing available supply even while many traders are betting on a decline.
This is the part I would watch closely.
When shorts become crowded while spot buyers continue buying then the market can become vulnerable to another short squeeze.
There is already a good example of how risky this positioning can become.
One large ZEC short position entered around $576 while ZEC is now above $1,100. The position is reportedly sitting on a very large unrealized loss.
But I would not assume a squeeze is guaranteed.
The derivatives market is actually cooling down.
ZEC Open Interest fell around 11.5% to $2.41B while derivatives volume dropped more than 42% to around $5.99B.
That means the large short ratio is not necessarily showing a wave of fresh shorts entering the market.
Some traders may simply be reducing their positions after ZEC's huge move.
This makes the current setup more balanced than the 72% short figure suggests.
On the chart there is another level I find important.
ZEC failed to clear the $1,256 area and has started pulling back. The fair value gap below the current price extends toward around $1,024.
For me $1,024 is the key support zone.
If buyers defend this area and spot buying stays strong then ZEC could attempt another move toward $1,256.
A clean break above that level could put the crowded shorts under much more pressure.
But if $1,024 fails then the bullish setup becomes weaker and the market could need a deeper correction.
The MACD is still positive which gives the bulls some support.
So I would not focus only on the 72% short figure.
The more important question is whether spot buyers continue absorbing supply while leverage stays controlled.
If that happens then the bearish positioning could become fuel for another move higher.
If spot demand disappears then those shorts may finally get the move they are waiting for.
Right now ZEC is not a simple bullish or bearish setup.
It is a battle between persistent spot buying and a crowded bearish derivatives market.
ZEC is holding around $1,128 after recently pushing above $1,100. But the derivatives market is showing a very strong bearish view.
Around 72% of top trader accounts are holding shorts while only 28% are long.
That sounds bearish at first.
But the spot market is telling a different story.
The 90 day Spot Taker CVD remains buyer dominant. That means aggressive spot buyers are still absorbing available supply even while many traders are betting on a decline.
This is the part I would watch closely.
When shorts become crowded while spot buyers continue buying then the market can become vulnerable to another short squeeze.
There is already a good example of how risky this positioning can become.
One large ZEC short position entered around $576 while ZEC is now above $1,100. The position is reportedly sitting on a very large unrealized loss.
But I would not assume a squeeze is guaranteed.
The derivatives market is actually cooling down.
ZEC Open Interest fell around 11.5% to $2.41B while derivatives volume dropped more than 42% to around $5.99B.
That means the large short ratio is not necessarily showing a wave of fresh shorts entering the market.
Some traders may simply be reducing their positions after ZEC's huge move.
This makes the current setup more balanced than the 72% short figure suggests.
On the chart there is another level I find important.
ZEC failed to clear the $1,256 area and has started pulling back. The fair value gap below the current price extends toward around $1,024.
For me $1,024 is the key support zone.
If buyers defend this area and spot buying stays strong then ZEC could attempt another move toward $1,256.
A clean break above that level could put the crowded shorts under much more pressure.
But if $1,024 fails then the bullish setup becomes weaker and the market could need a deeper correction.
The MACD is still positive which gives the bulls some support.
So I would not focus only on the 72% short figure.
The more important question is whether spot buyers continue absorbing supply while leverage stays controlled.
If that happens then the bearish positioning could become fuel for another move higher.
If spot demand disappears then those shorts may finally get the move they are waiting for.
Right now ZEC is not a simple bullish or bearish setup.
It is a battle between persistent spot buying and a crowded bearish derivatives market.
322
·
--

Статья
DOGE Is Now On Solana But The Real Test Is Whether The Demand StaysDogecoin just entered a new part of the crypto market.
DOGE can now be used inside the Solana ecosystem through Sunrise. This gives DOGE users easier access to Solana based DeFi without going through the usual complicated bridging process.
The early numbers were interesting.
DOGE reportedly generated more than $10M in trading volume within the first three hours. Over 24 hours that volume reached around $19M.
That is a strong start.
But I would not call it proof of long term demand yet.
The biggest benefit here is liquidity.
Dogecoin has mostly been known as a payment focused network. Its access to DeFi has been limited compared with assets that already have strong connections across different applications.
Now DOGE can potentially be traded and used for liquidity across Solana based applications.
That could create more reasons to hold DOGE.
But there is an important difference between accessibility and demand.
Making DOGE easier to use does not automatically mean people will buy more DOGE.
We already saw that in the price.
DOGE was trading around $0.089 despite the new integration. The token has still gained around 27% over the past month but the latest move has been slightly weaker.
Futures activity is also giving me a reason to stay careful.
Several September sessions saw long liquidations dominate as DOGE moved between roughly $0.08 and $0.09.
That suggests some traders may have become too confident on the upside.
For me the most important number is not the first $19M volume.
It is what happens after the launch excitement disappears.
If DOGE continues generating strong volume while liquidity remains inside the Solana ecosystem then this integration could become meaningful.
If volume quickly falls after the initial launch then the $19M figure will look more like launch speculation than lasting adoption.
The same applies to Solana.
The integration could bring more DOGE liquidity into the memecoin market and create more trading activity. But Solana needs sustained activity rather than one short burst.
DOGE is now easier to access across a much larger DeFi ecosystem.
That is a positive development.
But the market still needs to prove that users actually want to keep using it.
For now I would watch the $0.08 to $0.09 area and focus more on sustained volume than the launch day numbers.
DOGE Is Now On Solana But The Real Test Is Whether The Demand Stays
Dogecoin just entered a new part of the crypto market.
DOGE can now be used inside the Solana ecosystem through Sunrise. This gives DOGE users easier access to Solana based DeFi without going through the usual complicated bridging process.
The early numbers were interesting.
DOGE reportedly generated more than $10M in trading volume within the first three hours. Over 24 hours that volume reached around $19M.
That is a strong start.
But I would not call it proof of long term demand yet.
The biggest benefit here is liquidity.
Dogecoin has mostly been known as a payment focused network. Its access to DeFi has been limited compared with assets that already have strong connections across different applications.
Now DOGE can potentially be traded and used for liquidity across Solana based applications.
That could create more reasons to hold DOGE.
But there is an important difference between accessibility and demand.
Making DOGE easier to use does not automatically mean people will buy more DOGE.
We already saw that in the price.
DOGE was trading around $0.089 despite the new integration. The token has still gained around 27% over the past month but the latest move has been slightly weaker.
Futures activity is also giving me a reason to stay careful.
Several September sessions saw long liquidations dominate as DOGE moved between roughly $0.08 and $0.09.
That suggests some traders may have become too confident on the upside.
For me the most important number is not the first $19M volume.
It is what happens after the launch excitement disappears.
If DOGE continues generating strong volume while liquidity remains inside the Solana ecosystem then this integration could become meaningful.
If volume quickly falls after the initial launch then the $19M figure will look more like launch speculation than lasting adoption.
The same applies to Solana.
The integration could bring more DOGE liquidity into the memecoin market and create more trading activity. But Solana needs sustained activity rather than one short burst.
DOGE is now easier to access across a much larger DeFi ecosystem.
That is a positive development.
But the market still needs to prove that users actually want to keep using it.
For now I would watch the $0.08 to $0.09 area and focus more on sustained volume than the launch day numbers.
DOGE can now be used inside the Solana ecosystem through Sunrise. This gives DOGE users easier access to Solana based DeFi without going through the usual complicated bridging process.
The early numbers were interesting.
DOGE reportedly generated more than $10M in trading volume within the first three hours. Over 24 hours that volume reached around $19M.
That is a strong start.
But I would not call it proof of long term demand yet.
The biggest benefit here is liquidity.
Dogecoin has mostly been known as a payment focused network. Its access to DeFi has been limited compared with assets that already have strong connections across different applications.
Now DOGE can potentially be traded and used for liquidity across Solana based applications.
That could create more reasons to hold DOGE.
But there is an important difference between accessibility and demand.
Making DOGE easier to use does not automatically mean people will buy more DOGE.
We already saw that in the price.
DOGE was trading around $0.089 despite the new integration. The token has still gained around 27% over the past month but the latest move has been slightly weaker.
Futures activity is also giving me a reason to stay careful.
Several September sessions saw long liquidations dominate as DOGE moved between roughly $0.08 and $0.09.
That suggests some traders may have become too confident on the upside.
For me the most important number is not the first $19M volume.
It is what happens after the launch excitement disappears.
If DOGE continues generating strong volume while liquidity remains inside the Solana ecosystem then this integration could become meaningful.
If volume quickly falls after the initial launch then the $19M figure will look more like launch speculation than lasting adoption.
The same applies to Solana.
The integration could bring more DOGE liquidity into the memecoin market and create more trading activity. But Solana needs sustained activity rather than one short burst.
DOGE is now easier to access across a much larger DeFi ecosystem.
That is a positive development.
But the market still needs to prove that users actually want to keep using it.
For now I would watch the $0.08 to $0.09 area and focus more on sustained volume than the launch day numbers.
197
·
--

Статья
AERO Is Up 16 Percent But The Numbers Underneath Need AttentionAerodrome just had a strong move.
AERO jumped around 16% in 24 hours and has now gained roughly 84% over the past 180 days.
But despite that recovery the token is still about 73% below its all time high near $2.40.
So I would not look at this rally in isolation.
The first thing supporting AERO is growth in activity.
TVL increased from around $306.7M to $337.7M. That is roughly $31M of additional capital entering the protocol.
DEX volume is also improving.
Since August 5 volume reportedly climbed from around $305.8M to $520.8M. That is close to a 50% increase.
Those numbers tell me users are becoming more active and capital is moving through the protocol.
But there is a problem.
The protocol is still losing money.
Q3 earnings are around negative $8.15M after incentives. That is the largest quarterly loss reported since Q3 2025.
Token holder net income is also down to around $10.16M.
This creates an important question for me.
Can growing activity eventually turn into healthier protocol earnings?
More TVL and more volume are useful. But if the protocol needs heavy incentives to generate that activity then the growth may not be as strong as the price chart makes it look.
There is another warning coming from the spot market.
AERO spot netflow has remained positive for around 48 hours and is currently around $544K.
Positive exchange netflow generally means more AERO is moving toward exchanges than leaving them. That can increase potential selling pressure.
So right now I see two very different signals.
The protocol is getting more capital and more trading activity.
At the same time profitability is weak and some holders appear to be moving tokens toward exchanges.
That is why I would be careful about chasing the 16% move.
If TVL keeps rising and volume continues expanding while spot netflow turns negative then the rally would look much healthier to me.
But if exchange inflows remain positive and losses continue then AERO could struggle even with strong short term price momentum.
The next move will not be decided by the 16% candle.
It will be decided by whether Aerodrome can turn growing activity into sustainable value.
AERO Is Up 16 Percent But The Numbers Underneath Need Attention
Aerodrome just had a strong move.
AERO jumped around 16% in 24 hours and has now gained roughly 84% over the past 180 days.
But despite that recovery the token is still about 73% below its all time high near $2.40.
So I would not look at this rally in isolation.
The first thing supporting AERO is growth in activity.
TVL increased from around $306.7M to $337.7M. That is roughly $31M of additional capital entering the protocol.
DEX volume is also improving.
Since August 5 volume reportedly climbed from around $305.8M to $520.8M. That is close to a 50% increase.
Those numbers tell me users are becoming more active and capital is moving through the protocol.
But there is a problem.
The protocol is still losing money.
Q3 earnings are around negative $8.15M after incentives. That is the largest quarterly loss reported since Q3 2025.
Token holder net income is also down to around $10.16M.
This creates an important question for me.
Can growing activity eventually turn into healthier protocol earnings?
More TVL and more volume are useful. But if the protocol needs heavy incentives to generate that activity then the growth may not be as strong as the price chart makes it look.
There is another warning coming from the spot market.
AERO spot netflow has remained positive for around 48 hours and is currently around $544K.
Positive exchange netflow generally means more AERO is moving toward exchanges than leaving them. That can increase potential selling pressure.
So right now I see two very different signals.
The protocol is getting more capital and more trading activity.
At the same time profitability is weak and some holders appear to be moving tokens toward exchanges.
That is why I would be careful about chasing the 16% move.
If TVL keeps rising and volume continues expanding while spot netflow turns negative then the rally would look much healthier to me.
But if exchange inflows remain positive and losses continue then AERO could struggle even with strong short term price momentum.
The next move will not be decided by the 16% candle.
It will be decided by whether Aerodrome can turn growing activity into sustainable value.
AERO jumped around 16% in 24 hours and has now gained roughly 84% over the past 180 days.
But despite that recovery the token is still about 73% below its all time high near $2.40.
So I would not look at this rally in isolation.
The first thing supporting AERO is growth in activity.
TVL increased from around $306.7M to $337.7M. That is roughly $31M of additional capital entering the protocol.
DEX volume is also improving.
Since August 5 volume reportedly climbed from around $305.8M to $520.8M. That is close to a 50% increase.
Those numbers tell me users are becoming more active and capital is moving through the protocol.
But there is a problem.
The protocol is still losing money.
Q3 earnings are around negative $8.15M after incentives. That is the largest quarterly loss reported since Q3 2025.
Token holder net income is also down to around $10.16M.
This creates an important question for me.
Can growing activity eventually turn into healthier protocol earnings?
More TVL and more volume are useful. But if the protocol needs heavy incentives to generate that activity then the growth may not be as strong as the price chart makes it look.
There is another warning coming from the spot market.
AERO spot netflow has remained positive for around 48 hours and is currently around $544K.
Positive exchange netflow generally means more AERO is moving toward exchanges than leaving them. That can increase potential selling pressure.
So right now I see two very different signals.
The protocol is getting more capital and more trading activity.
At the same time profitability is weak and some holders appear to be moving tokens toward exchanges.
That is why I would be careful about chasing the 16% move.
If TVL keeps rising and volume continues expanding while spot netflow turns negative then the rally would look much healthier to me.
But if exchange inflows remain positive and losses continue then AERO could struggle even with strong short term price momentum.
The next move will not be decided by the 16% candle.
It will be decided by whether Aerodrome can turn growing activity into sustainable value.
119
·
--

Статья
Ethereum Could Be Changing What ETH Is Actually Needed ForEthereum is looking at an upgrade that could change the relationship between ETH and network usage.
The proposed EIP 8141 Frames upgrade would allow users to pay gas fees with stablecoins instead of needing ETH for every transaction.
At first this sounds like a simple convenience feature.
But I think the bigger question is what it means for ETH demand.
Today users need ETH to pay gas. That creates a direct link between network activity and demand for ETH.
If stablecoins can be used for gas then that link becomes weaker.
Someone could hold USDC or another stablecoin and interact with Ethereum without first buying ETH just to cover transaction fees.
That sounds negative for ETH at first.
But there is another side.
Ethereum already holds a huge share of the stablecoin market. The network reportedly has around $147B in stablecoin liquidity and close to half of the total stablecoin supply.
If stablecoin usage keeps growing then making Ethereum easier to use could bring even more activity onto the network.
That could matter much more during the next DeFi cycle.
Stablecoins are increasingly being used for payments and settlement. If users can move stablecoins and pay fees with the same assets then the friction becomes much lower.
For me this is where the upgrade gets interesting.
Ethereum may be moving away from the idea that every user must directly interact with ETH for every transaction.
Instead ETH could become more of the asset securing the network while stablecoins become the everyday payment layer.
That does not automatically mean ETH price will rise.
In fact there is a real tradeoff here.
Less direct need for ETH to pay gas could reduce one source of natural ETH demand. So the bullish case has to come from increased network activity and stronger DeFi usage rather than simply assuming more transactions equal more ETH buying.
That is the part I would watch.
If stablecoin activity grows sharply after this model becomes available and Ethereum captures more users then the upgrade could strengthen Ethereum's overall utility.
But if stablecoin payments simply replace ETH gas without creating much additional activity then the impact on ETH could be much smaller.
So I would not call EIP 8141 an automatic bullish upgrade for ETH.
The more interesting possibility is that Ethereum becomes easier to use for billions of dollars in stablecoin activity.
And if that brings a new wave of DeFi users then ETH could benefit from the ecosystem growth even if users are no longer buying ETH just to pay gas.
Ethereum Could Be Changing What ETH Is Actually Needed For
Ethereum is looking at an upgrade that could change the relationship between ETH and network usage.
The proposed EIP 8141 Frames upgrade would allow users to pay gas fees with stablecoins instead of needing ETH for every transaction.
At first this sounds like a simple convenience feature.
But I think the bigger question is what it means for ETH demand.
Today users need ETH to pay gas. That creates a direct link between network activity and demand for ETH.
If stablecoins can be used for gas then that link becomes weaker.
Someone could hold USDC or another stablecoin and interact with Ethereum without first buying ETH just to cover transaction fees.
That sounds negative for ETH at first.
But there is another side.
Ethereum already holds a huge share of the stablecoin market. The network reportedly has around $147B in stablecoin liquidity and close to half of the total stablecoin supply.
If stablecoin usage keeps growing then making Ethereum easier to use could bring even more activity onto the network.
That could matter much more during the next DeFi cycle.
Stablecoins are increasingly being used for payments and settlement. If users can move stablecoins and pay fees with the same assets then the friction becomes much lower.
For me this is where the upgrade gets interesting.
Ethereum may be moving away from the idea that every user must directly interact with ETH for every transaction.
Instead ETH could become more of the asset securing the network while stablecoins become the everyday payment layer.
That does not automatically mean ETH price will rise.
In fact there is a real tradeoff here.
Less direct need for ETH to pay gas could reduce one source of natural ETH demand. So the bullish case has to come from increased network activity and stronger DeFi usage rather than simply assuming more transactions equal more ETH buying.
That is the part I would watch.
If stablecoin activity grows sharply after this model becomes available and Ethereum captures more users then the upgrade could strengthen Ethereum's overall utility.
But if stablecoin payments simply replace ETH gas without creating much additional activity then the impact on ETH could be much smaller.
So I would not call EIP 8141 an automatic bullish upgrade for ETH.
The more interesting possibility is that Ethereum becomes easier to use for billions of dollars in stablecoin activity.
And if that brings a new wave of DeFi users then ETH could benefit from the ecosystem growth even if users are no longer buying ETH just to pay gas.
The proposed EIP 8141 Frames upgrade would allow users to pay gas fees with stablecoins instead of needing ETH for every transaction.
At first this sounds like a simple convenience feature.
But I think the bigger question is what it means for ETH demand.
Today users need ETH to pay gas. That creates a direct link between network activity and demand for ETH.
If stablecoins can be used for gas then that link becomes weaker.
Someone could hold USDC or another stablecoin and interact with Ethereum without first buying ETH just to cover transaction fees.
That sounds negative for ETH at first.
But there is another side.
Ethereum already holds a huge share of the stablecoin market. The network reportedly has around $147B in stablecoin liquidity and close to half of the total stablecoin supply.
If stablecoin usage keeps growing then making Ethereum easier to use could bring even more activity onto the network.
That could matter much more during the next DeFi cycle.
Stablecoins are increasingly being used for payments and settlement. If users can move stablecoins and pay fees with the same assets then the friction becomes much lower.
For me this is where the upgrade gets interesting.
Ethereum may be moving away from the idea that every user must directly interact with ETH for every transaction.
Instead ETH could become more of the asset securing the network while stablecoins become the everyday payment layer.
That does not automatically mean ETH price will rise.
In fact there is a real tradeoff here.
Less direct need for ETH to pay gas could reduce one source of natural ETH demand. So the bullish case has to come from increased network activity and stronger DeFi usage rather than simply assuming more transactions equal more ETH buying.
That is the part I would watch.
If stablecoin activity grows sharply after this model becomes available and Ethereum captures more users then the upgrade could strengthen Ethereum's overall utility.
But if stablecoin payments simply replace ETH gas without creating much additional activity then the impact on ETH could be much smaller.
So I would not call EIP 8141 an automatic bullish upgrade for ETH.
The more interesting possibility is that Ethereum becomes easier to use for billions of dollars in stablecoin activity.
And if that brings a new wave of DeFi users then ETH could benefit from the ecosystem growth even if users are no longer buying ETH just to pay gas.
108
·
--

Статья
XRP Just Got A Leverage Reset And That Could Matter More Than The LiquidationsXRP just went through a serious market cleanup.
Open Interest dropped 14% from around $558M to $478M. Leverage also fell from 0.203 to 0.182 after roughly $14.2M in liquidations hit both sides of the market within 48 hours.
For me this is not automatically bearish.
A large liquidation flush can remove traders who were using too much leverage. That can leave the market in a healthier position if spot demand remains strong afterward.
Funding also turned slightly negative at around minus 0.002.
That ended a long stretch of positive funding and tells me traders are no longer aggressively chasing XRP longs.
But the more interesting part is what did not happen.
Binance reserves stayed almost flat near 2.62B XRP. Deposit addresses also dropped around 91%.
So leverage was removed without a major rush of XRP toward exchanges.
That is an important difference.
If exchange reserves were rising at the same time then I would be more concerned about fresh selling pressure. For now the data looks more like traders getting flushed while holders remain relatively calm.
And there is another story developing underneath the price.
XRPL asset value has grown from around $99M in Q1 2025 to roughly $4.26B by Q2 2026.
That is a huge change.
The growth has also continued quarter after quarter rather than appearing as one short spike.
Stablecoin activity is becoming another important part of this story.
RLUSD transferred value reportedly jumped 925% year over year. That suggests stablecoins are becoming more active inside the XRPL ecosystem and could support more settlement and liquidity over time.
RWAs are also expanding. But most of that value appears to be held through registry style structures rather than constantly moving between users.
So I see two different forces right now.
Short term leverage has cooled down.
Longer term network activity is still developing.
The next XRP move will depend on whether spot buyers return after this reset.
If Open Interest stays controlled while XRP demand improves then this liquidation flush could become the foundation for a recovery.
But if price starts falling while spot demand remains weak then the reset will not be enough.
I would watch exchange reserves and spot buying more closely than leverage right now.
A cleaner derivatives market is useful.
But XRP still needs real buyers to turn that reset into a sustained recovery.
XRP Just Got A Leverage Reset And That Could Matter More Than The Liquidations
XRP just went through a serious market cleanup.
Open Interest dropped 14% from around $558M to $478M. Leverage also fell from 0.203 to 0.182 after roughly $14.2M in liquidations hit both sides of the market within 48 hours.
For me this is not automatically bearish.
A large liquidation flush can remove traders who were using too much leverage. That can leave the market in a healthier position if spot demand remains strong afterward.
Funding also turned slightly negative at around minus 0.002.
That ended a long stretch of positive funding and tells me traders are no longer aggressively chasing XRP longs.
But the more interesting part is what did not happen.
Binance reserves stayed almost flat near 2.62B XRP. Deposit addresses also dropped around 91%.
So leverage was removed without a major rush of XRP toward exchanges.
That is an important difference.
If exchange reserves were rising at the same time then I would be more concerned about fresh selling pressure. For now the data looks more like traders getting flushed while holders remain relatively calm.
And there is another story developing underneath the price.
XRPL asset value has grown from around $99M in Q1 2025 to roughly $4.26B by Q2 2026.
That is a huge change.
The growth has also continued quarter after quarter rather than appearing as one short spike.
Stablecoin activity is becoming another important part of this story.
RLUSD transferred value reportedly jumped 925% year over year. That suggests stablecoins are becoming more active inside the XRPL ecosystem and could support more settlement and liquidity over time.
RWAs are also expanding. But most of that value appears to be held through registry style structures rather than constantly moving between users.
So I see two different forces right now.
Short term leverage has cooled down.
Longer term network activity is still developing.
The next XRP move will depend on whether spot buyers return after this reset.
If Open Interest stays controlled while XRP demand improves then this liquidation flush could become the foundation for a recovery.
But if price starts falling while spot demand remains weak then the reset will not be enough.
I would watch exchange reserves and spot buying more closely than leverage right now.
A cleaner derivatives market is useful.
But XRP still needs real buyers to turn that reset into a sustained recovery.
Open Interest dropped 14% from around $558M to $478M. Leverage also fell from 0.203 to 0.182 after roughly $14.2M in liquidations hit both sides of the market within 48 hours.
For me this is not automatically bearish.
A large liquidation flush can remove traders who were using too much leverage. That can leave the market in a healthier position if spot demand remains strong afterward.
Funding also turned slightly negative at around minus 0.002.
That ended a long stretch of positive funding and tells me traders are no longer aggressively chasing XRP longs.
But the more interesting part is what did not happen.
Binance reserves stayed almost flat near 2.62B XRP. Deposit addresses also dropped around 91%.
So leverage was removed without a major rush of XRP toward exchanges.
That is an important difference.
If exchange reserves were rising at the same time then I would be more concerned about fresh selling pressure. For now the data looks more like traders getting flushed while holders remain relatively calm.
And there is another story developing underneath the price.
XRPL asset value has grown from around $99M in Q1 2025 to roughly $4.26B by Q2 2026.
That is a huge change.
The growth has also continued quarter after quarter rather than appearing as one short spike.
Stablecoin activity is becoming another important part of this story.
RLUSD transferred value reportedly jumped 925% year over year. That suggests stablecoins are becoming more active inside the XRPL ecosystem and could support more settlement and liquidity over time.
RWAs are also expanding. But most of that value appears to be held through registry style structures rather than constantly moving between users.
So I see two different forces right now.
Short term leverage has cooled down.
Longer term network activity is still developing.
The next XRP move will depend on whether spot buyers return after this reset.
If Open Interest stays controlled while XRP demand improves then this liquidation flush could become the foundation for a recovery.
But if price starts falling while spot demand remains weak then the reset will not be enough.
I would watch exchange reserves and spot buying more closely than leverage right now.
A cleaner derivatives market is useful.
But XRP still needs real buyers to turn that reset into a sustained recovery.
1
166
·
--

Статья
WLD Is Up 13 Percent But The $0.45 Level Could Decide EverythingWorldcoin is moving fast again.
WLD jumped more than 13% in 24 hours and pushed weekly gains above 26%. Over the past month the move has been even stronger with gains above 50%.
What caught my attention is that this rally came while a major token unlock was happening.
Around 69M WLD tokens worth roughly $28M were unlocked on September 7. Normally an event like this can create extra selling pressure.
But buyers absorbed it.
The bigger reason seems to be renewed interest in AI related crypto projects. Several AI focused tokens have also moved higher at the same time. That tells me this may not be only a WLD specific move.
Spot buying is also showing improvement.
Spot Taker CVD turned positive near the end of August and stayed stronger into September. That suggests buyers have started taking more control of the spot market.
Leverage is adding fuel too.
Top trader long short ratios moved above 1.90 in some readings. Short liquidations also crossed $1.2M in 12 hours while long liquidations were around $490K.
That difference matters.
When shorts are forced to close during a strong move they can create additional buying pressure and make the rally move much faster.
But this is where I would stay careful.
WLD has now pushed into the $0.41 to $0.45 area. This was an important previous lower high and also sits around the neckline of an inverted head and shoulders setup.
So $0.45 is not just another price.
It is the level that needs to become support.
If WLD can hold above $0.45 then the next areas I would watch are $0.55 and later around $0.67.
But RSI is already near 67 and the bearish divergence mentioned in the data has not disappeared. More WLD unlocks are also expected during September.
That creates a simple situation for me.
Above $0.45 with strong spot demand could confirm that the market structure is changing.
Failure to hold it could turn this entire move into another temporary bounce.
I would not chase a 13% candle here.
I would rather see whether buyers can defend $0.45 after the excitement cools down.
That reaction will tell us much more than the rally itself.
WLD Is Up 13 Percent But The $0.45 Level Could Decide Everything
Worldcoin is moving fast again.
WLD jumped more than 13% in 24 hours and pushed weekly gains above 26%. Over the past month the move has been even stronger with gains above 50%.
What caught my attention is that this rally came while a major token unlock was happening.
Around 69M WLD tokens worth roughly $28M were unlocked on September 7. Normally an event like this can create extra selling pressure.
But buyers absorbed it.
The bigger reason seems to be renewed interest in AI related crypto projects. Several AI focused tokens have also moved higher at the same time. That tells me this may not be only a WLD specific move.
Spot buying is also showing improvement.
Spot Taker CVD turned positive near the end of August and stayed stronger into September. That suggests buyers have started taking more control of the spot market.
Leverage is adding fuel too.
Top trader long short ratios moved above 1.90 in some readings. Short liquidations also crossed $1.2M in 12 hours while long liquidations were around $490K.
That difference matters.
When shorts are forced to close during a strong move they can create additional buying pressure and make the rally move much faster.
But this is where I would stay careful.
WLD has now pushed into the $0.41 to $0.45 area. This was an important previous lower high and also sits around the neckline of an inverted head and shoulders setup.
So $0.45 is not just another price.
It is the level that needs to become support.
If WLD can hold above $0.45 then the next areas I would watch are $0.55 and later around $0.67.
But RSI is already near 67 and the bearish divergence mentioned in the data has not disappeared. More WLD unlocks are also expected during September.
That creates a simple situation for me.
Above $0.45 with strong spot demand could confirm that the market structure is changing.
Failure to hold it could turn this entire move into another temporary bounce.
I would not chase a 13% candle here.
I would rather see whether buyers can defend $0.45 after the excitement cools down.
That reaction will tell us much more than the rally itself.
WLD jumped more than 13% in 24 hours and pushed weekly gains above 26%. Over the past month the move has been even stronger with gains above 50%.
What caught my attention is that this rally came while a major token unlock was happening.
Around 69M WLD tokens worth roughly $28M were unlocked on September 7. Normally an event like this can create extra selling pressure.
But buyers absorbed it.
The bigger reason seems to be renewed interest in AI related crypto projects. Several AI focused tokens have also moved higher at the same time. That tells me this may not be only a WLD specific move.
Spot buying is also showing improvement.
Spot Taker CVD turned positive near the end of August and stayed stronger into September. That suggests buyers have started taking more control of the spot market.
Leverage is adding fuel too.
Top trader long short ratios moved above 1.90 in some readings. Short liquidations also crossed $1.2M in 12 hours while long liquidations were around $490K.
That difference matters.
When shorts are forced to close during a strong move they can create additional buying pressure and make the rally move much faster.
But this is where I would stay careful.
WLD has now pushed into the $0.41 to $0.45 area. This was an important previous lower high and also sits around the neckline of an inverted head and shoulders setup.
So $0.45 is not just another price.
It is the level that needs to become support.
If WLD can hold above $0.45 then the next areas I would watch are $0.55 and later around $0.67.
But RSI is already near 67 and the bearish divergence mentioned in the data has not disappeared. More WLD unlocks are also expected during September.
That creates a simple situation for me.
Above $0.45 with strong spot demand could confirm that the market structure is changing.
Failure to hold it could turn this entire move into another temporary bounce.
I would not chase a 13% candle here.
I would rather see whether buyers can defend $0.45 after the excitement cools down.
That reaction will tell us much more than the rally itself.
2
409
·
--

Статья
TIA Hit $0.48 But The Real Test Is Whether Buyers Can Absorb The SellingCelestia just made a strong move.
TIA climbed around 11% in 24 hours and broke above the $0.42 resistance before reaching a four month high near $0.48. Trading volume also jumped almost 300%.
But the part I find more interesting is what happened after the move.
TIA pulled back from $0.48 to around $0.43. That tells me buyers pushed hard but sellers were waiting at the higher levels.
There are a few reasons behind the renewed interest.
Celestia is getting more attention for its role as a data availability layer for modular blockchains. The idea is simple. Rollups need a scalable way to make data available without putting everything directly on one chain.
Staking is another part of the story.
Around 393.9 million TIA are reportedly staked. That is roughly 43% of the total supply. The staking reward rate is around 5.48% which can make holding TIA more attractive for some investors.
But the price action is showing a problem.
Profit taking is clearly increasing.
Futures recorded around $92M in outflows against $87.6M in inflows over the past 24 hours. Futures netflow also dropped sharply to around minus $4.4M.
Spot data is showing something similar.
Exchange inflows were around $15.3M while outflows were around $14.7M. That pushed spot netflow positive to around $595K.
These numbers are not enough to say the rally is finished. But they do show that sellers are becoming more active after the move higher.
The chart still looks strong though.
Stochastic RSI is around 88 and DMI is around 40. Both are showing strong momentum. The issue is that these readings also mean the market is getting stretched after a fast move.
For me the levels are simple.
$0.42 is now the important support area.
If TIA holds above it and buyers return then $0.48 can come back into focus. A clean break above $0.48 could open the way toward $0.50.
But if profit taking pushes TIA below $0.40 then I would start watching $0.34.
I would not chase the $0.48 move.
The real question is not whether TIA can touch $0.48 again.
It is whether buyers can hold the price there while sellers keep taking profit.
TIA Hit $0.48 But The Real Test Is Whether Buyers Can Absorb The Selling
Celestia just made a strong move.
TIA climbed around 11% in 24 hours and broke above the $0.42 resistance before reaching a four month high near $0.48. Trading volume also jumped almost 300%.
But the part I find more interesting is what happened after the move.
TIA pulled back from $0.48 to around $0.43. That tells me buyers pushed hard but sellers were waiting at the higher levels.
There are a few reasons behind the renewed interest.
Celestia is getting more attention for its role as a data availability layer for modular blockchains. The idea is simple. Rollups need a scalable way to make data available without putting everything directly on one chain.
Staking is another part of the story.
Around 393.9 million TIA are reportedly staked. That is roughly 43% of the total supply. The staking reward rate is around 5.48% which can make holding TIA more attractive for some investors.
But the price action is showing a problem.
Profit taking is clearly increasing.
Futures recorded around $92M in outflows against $87.6M in inflows over the past 24 hours. Futures netflow also dropped sharply to around minus $4.4M.
Spot data is showing something similar.
Exchange inflows were around $15.3M while outflows were around $14.7M. That pushed spot netflow positive to around $595K.
These numbers are not enough to say the rally is finished. But they do show that sellers are becoming more active after the move higher.
The chart still looks strong though.
Stochastic RSI is around 88 and DMI is around 40. Both are showing strong momentum. The issue is that these readings also mean the market is getting stretched after a fast move.
For me the levels are simple.
$0.42 is now the important support area.
If TIA holds above it and buyers return then $0.48 can come back into focus. A clean break above $0.48 could open the way toward $0.50.
But if profit taking pushes TIA below $0.40 then I would start watching $0.34.
I would not chase the $0.48 move.
The real question is not whether TIA can touch $0.48 again.
It is whether buyers can hold the price there while sellers keep taking profit.
TIA climbed around 11% in 24 hours and broke above the $0.42 resistance before reaching a four month high near $0.48. Trading volume also jumped almost 300%.
But the part I find more interesting is what happened after the move.
TIA pulled back from $0.48 to around $0.43. That tells me buyers pushed hard but sellers were waiting at the higher levels.
There are a few reasons behind the renewed interest.
Celestia is getting more attention for its role as a data availability layer for modular blockchains. The idea is simple. Rollups need a scalable way to make data available without putting everything directly on one chain.
Staking is another part of the story.
Around 393.9 million TIA are reportedly staked. That is roughly 43% of the total supply. The staking reward rate is around 5.48% which can make holding TIA more attractive for some investors.
But the price action is showing a problem.
Profit taking is clearly increasing.
Futures recorded around $92M in outflows against $87.6M in inflows over the past 24 hours. Futures netflow also dropped sharply to around minus $4.4M.
Spot data is showing something similar.
Exchange inflows were around $15.3M while outflows were around $14.7M. That pushed spot netflow positive to around $595K.
These numbers are not enough to say the rally is finished. But they do show that sellers are becoming more active after the move higher.
The chart still looks strong though.
Stochastic RSI is around 88 and DMI is around 40. Both are showing strong momentum. The issue is that these readings also mean the market is getting stretched after a fast move.
For me the levels are simple.
$0.42 is now the important support area.
If TIA holds above it and buyers return then $0.48 can come back into focus. A clean break above $0.48 could open the way toward $0.50.
But if profit taking pushes TIA below $0.40 then I would start watching $0.34.
I would not chase the $0.48 move.
The real question is not whether TIA can touch $0.48 again.
It is whether buyers can hold the price there while sellers keep taking profit.
1
283
·
--
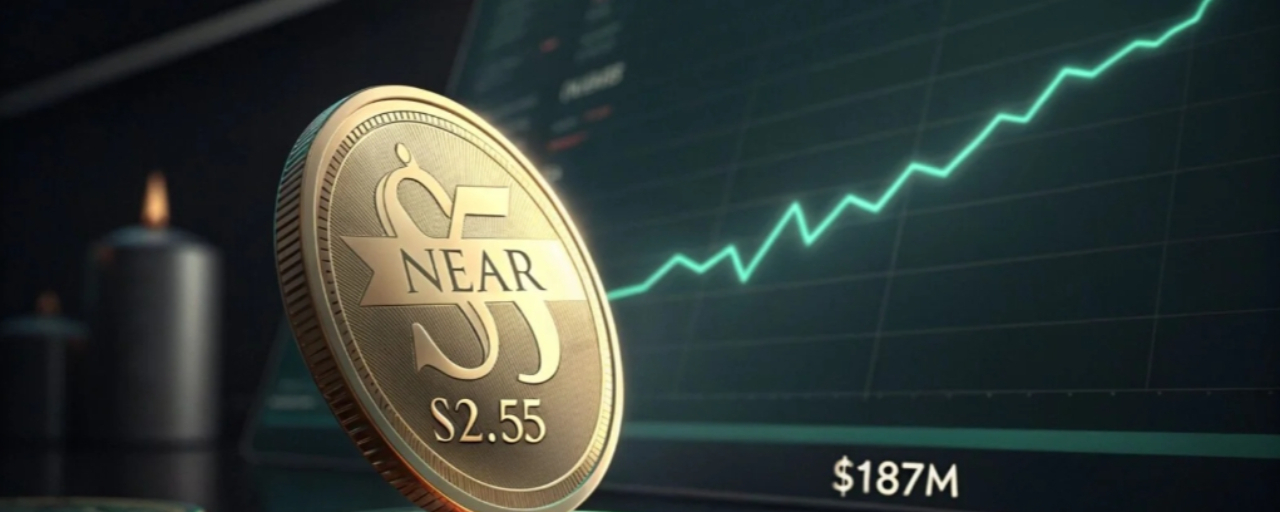
Статья
NEAR Is Near $2.55 But Profit Taking Could Be The Next TestNEAR is moving quickly again.
The token gained around 10 percent in the last 24 hours and is now close to the $2.55 resistance level.
What makes this move interesting is the volume.
Trading volume jumped 67 percent to around $676M. That tells me buyers are still active and the move is not happening on weak activity.
NEAR also broke out from a pennant pattern after spending weeks in consolidation.
But there is another part of the story that caught my attention.
Network TVL has climbed sharply.
TVL increased from around $83M on August 17 to more than $185M. That is a major change in a short period.
Rising TVL does not guarantee that the token price will keep going higher. But it does show that more capital is being placed inside the ecosystem while the price and trading activity are also improving.
Technically the setup remains strong.
NEAR is trading above its key daily EMAs around $2.43.
That gives buyers a better short term structure.
But now comes the difficult part.
$2.50 to $2.55 is the area I would watch closely.
NEAR has already moved strongly and traders sitting on profits may start selling into this resistance.
If volume remains high and buyers push through $2.55 then the old resistance could become support.
That would make the breakout much more convincing.
But if NEAR gets rejected around $2.50 to $2.55 and volume starts falling then a short term correction would not surprise me.
For me the next move is more important than the recent 10 percent gain.
The fundamentals are improving.
The trading activity is strong.
The chart is bullish.
But price still needs to prove that $2.55 can turn from resistance into support.
I would not chase the move just because NEAR is close to a breakout.
A clean breakout with strong volume is what I want to see.
Until then $2.55 remains the level that decides whether this rally has more room or needs a pause.
NEAR Is Near $2.55 But Profit Taking Could Be The Next Test
NEAR is moving quickly again.
The token gained around 10 percent in the last 24 hours and is now close to the $2.55 resistance level.
What makes this move interesting is the volume.
Trading volume jumped 67 percent to around $676M. That tells me buyers are still active and the move is not happening on weak activity.
NEAR also broke out from a pennant pattern after spending weeks in consolidation.
But there is another part of the story that caught my attention.
Network TVL has climbed sharply.
TVL increased from around $83M on August 17 to more than $185M. That is a major change in a short period.
Rising TVL does not guarantee that the token price will keep going higher. But it does show that more capital is being placed inside the ecosystem while the price and trading activity are also improving.
Technically the setup remains strong.
NEAR is trading above its key daily EMAs around $2.43.
That gives buyers a better short term structure.
But now comes the difficult part.
$2.50 to $2.55 is the area I would watch closely.
NEAR has already moved strongly and traders sitting on profits may start selling into this resistance.
If volume remains high and buyers push through $2.55 then the old resistance could become support.
That would make the breakout much more convincing.
But if NEAR gets rejected around $2.50 to $2.55 and volume starts falling then a short term correction would not surprise me.
For me the next move is more important than the recent 10 percent gain.
The fundamentals are improving.
The trading activity is strong.
The chart is bullish.
But price still needs to prove that $2.55 can turn from resistance into support.
I would not chase the move just because NEAR is close to a breakout.
A clean breakout with strong volume is what I want to see.
Until then $2.55 remains the level that decides whether this rally has more room or needs a pause.
The token gained around 10 percent in the last 24 hours and is now close to the $2.55 resistance level.
What makes this move interesting is the volume.
Trading volume jumped 67 percent to around $676M. That tells me buyers are still active and the move is not happening on weak activity.
NEAR also broke out from a pennant pattern after spending weeks in consolidation.
But there is another part of the story that caught my attention.
Network TVL has climbed sharply.
TVL increased from around $83M on August 17 to more than $185M. That is a major change in a short period.
Rising TVL does not guarantee that the token price will keep going higher. But it does show that more capital is being placed inside the ecosystem while the price and trading activity are also improving.
Technically the setup remains strong.
NEAR is trading above its key daily EMAs around $2.43.
That gives buyers a better short term structure.
But now comes the difficult part.
$2.50 to $2.55 is the area I would watch closely.
NEAR has already moved strongly and traders sitting on profits may start selling into this resistance.
If volume remains high and buyers push through $2.55 then the old resistance could become support.
That would make the breakout much more convincing.
But if NEAR gets rejected around $2.50 to $2.55 and volume starts falling then a short term correction would not surprise me.
For me the next move is more important than the recent 10 percent gain.
The fundamentals are improving.
The trading activity is strong.
The chart is bullish.
But price still needs to prove that $2.55 can turn from resistance into support.
I would not chase the move just because NEAR is close to a breakout.
A clean breakout with strong volume is what I want to see.
Until then $2.55 remains the level that decides whether this rally has more room or needs a pause.
332
·
--

Статья
MSTR Is Up 60 Percent But $150 Is The Real TestMSTR has made a strong recovery from its June low.
The stock dropped to around $87 in late June after trading near $195 in May. Since then it has recovered more than 60 percent and recently closed around $142.80.
That sounds impressive.
But the bigger picture is still very different.
MSTR remains down around 56 percent over the past year.
For me the next important area is $145 to $150.
This zone has stopped previous rallies. If buyers can push through it and hold above it then $160 could become the next target.
But if the stock gets rejected again then $120 to $125 becomes an important support area.
The bigger question is whether MSTR can really reach the $435 target from Benchmark analyst Mark Palmer.
At $142.80 that would require the stock to rise more than 200 percent.
That is a very aggressive target compared with the wider analyst expectations.
The reason MSTR can move so much is simple.
It gives investors amplified exposure to Bitcoin.
When Bitcoin rises strongly MSTR can outperform.
But the same structure works in reverse.
If Bitcoin falls then MSTR can fall much harder.
Strategy reportedly holds around 845050 BTC while also carrying around $6.7B in convertible debt based on its Q2 results.
That makes Bitcoin price action extremely important for the stock.
If BTC enters another strong uptrend then MSTR could benefit from the leverage built into its business model.
But if Bitcoin weakens then the stock can face much stronger pressure.
There is also the risk of additional share offerings which can increase the number of shares and affect existing shareholders.
So I would not look at the $435 target and assume it is the next destination.
For me $150 is the first real test.
Above $150 could open the door toward $160 and potentially higher.
A rejection around $145 to $150 could send MSTR back toward $120 to $125.
The 60 percent rebound is impressive.
But MSTR still has a lot to prove before a $435 valuation starts looking realistic.
MSTR Is Up 60 Percent But $150 Is The Real Test
MSTR has made a strong recovery from its June low.
The stock dropped to around $87 in late June after trading near $195 in May. Since then it has recovered more than 60 percent and recently closed around $142.80.
That sounds impressive.
But the bigger picture is still very different.
MSTR remains down around 56 percent over the past year.
For me the next important area is $145 to $150.
This zone has stopped previous rallies. If buyers can push through it and hold above it then $160 could become the next target.
But if the stock gets rejected again then $120 to $125 becomes an important support area.
The bigger question is whether MSTR can really reach the $435 target from Benchmark analyst Mark Palmer.
At $142.80 that would require the stock to rise more than 200 percent.
That is a very aggressive target compared with the wider analyst expectations.
The reason MSTR can move so much is simple.
It gives investors amplified exposure to Bitcoin.
When Bitcoin rises strongly MSTR can outperform.
But the same structure works in reverse.
If Bitcoin falls then MSTR can fall much harder.
Strategy reportedly holds around 845050 BTC while also carrying around $6.7B in convertible debt based on its Q2 results.
That makes Bitcoin price action extremely important for the stock.
If BTC enters another strong uptrend then MSTR could benefit from the leverage built into its business model.
But if Bitcoin weakens then the stock can face much stronger pressure.
There is also the risk of additional share offerings which can increase the number of shares and affect existing shareholders.
So I would not look at the $435 target and assume it is the next destination.
For me $150 is the first real test.
Above $150 could open the door toward $160 and potentially higher.
A rejection around $145 to $150 could send MSTR back toward $120 to $125.
The 60 percent rebound is impressive.
But MSTR still has a lot to prove before a $435 valuation starts looking realistic.
The stock dropped to around $87 in late June after trading near $195 in May. Since then it has recovered more than 60 percent and recently closed around $142.80.
That sounds impressive.
But the bigger picture is still very different.
MSTR remains down around 56 percent over the past year.
For me the next important area is $145 to $150.
This zone has stopped previous rallies. If buyers can push through it and hold above it then $160 could become the next target.
But if the stock gets rejected again then $120 to $125 becomes an important support area.
The bigger question is whether MSTR can really reach the $435 target from Benchmark analyst Mark Palmer.
At $142.80 that would require the stock to rise more than 200 percent.
That is a very aggressive target compared with the wider analyst expectations.
The reason MSTR can move so much is simple.
It gives investors amplified exposure to Bitcoin.
When Bitcoin rises strongly MSTR can outperform.
But the same structure works in reverse.
If Bitcoin falls then MSTR can fall much harder.
Strategy reportedly holds around 845050 BTC while also carrying around $6.7B in convertible debt based on its Q2 results.
That makes Bitcoin price action extremely important for the stock.
If BTC enters another strong uptrend then MSTR could benefit from the leverage built into its business model.
But if Bitcoin weakens then the stock can face much stronger pressure.
There is also the risk of additional share offerings which can increase the number of shares and affect existing shareholders.
So I would not look at the $435 target and assume it is the next destination.
For me $150 is the first real test.
Above $150 could open the door toward $160 and potentially higher.
A rejection around $145 to $150 could send MSTR back toward $120 to $125.
The 60 percent rebound is impressive.
But MSTR still has a lot to prove before a $435 valuation starts looking realistic.
103
·
--

Статья
ZCAT Is Up 35 Percent But The Reward Model Needs A Closer LookZCAT has suddenly attracted a lot of attention.
The token jumped around 35 percent in 24 hours and reached a market cap near $150M. Trading volume also reached around $40.9M.
But the price move is not the most interesting part for me.
The bigger story is the ZEC reward system.
ZCAT reportedly distributed around 2320 ZEC worth roughly $2.8M to holders.
The model is simple.
Every ZCAT transaction has a 3 percent fee. Most of that fee is used to buy ZEC. The ZEC is then distributed to eligible ZCAT holders.
That sounds attractive on the surface.
But there is an important catch.
The rewards depend on people continuing to trade and transfer ZCAT.
So the same activity that creates rewards also creates the fees needed to fund them.
If trading activity slows down then future rewards can also become smaller.
There is also a minimum holding requirement of around $20 worth of ZCAT.
The project says more than 470000 payments have already been made. But that does not mean 470000 different holders received rewards. One wallet can receive multiple payments.
This distinction matters when trying to judge actual adoption.
The price action itself is another warning.
ZCAT moved between roughly $0.090 and $0.175 in just 24 hours.
That is a massive range for a token that has only existed for a few days.
Anyone buying near the daily high could have faced a sharp loss shortly after.
For me the biggest question is sustainability.
The reward system can attract buyers while ZCAT activity remains high. But it still needs continuous trading activity to keep the system going.
The connection with ZEC is interesting because Zcash has also been performing strongly.
But a strong ZEC market does not automatically guarantee lasting demand for ZCAT.
Right now I would treat ZCAT as a highly speculative asset.
The reward model is interesting.
The early numbers are impressive.
But the token needs to prove that demand can survive after the initial excitement fades.
A 35 percent move looks great on the chart.
The real test is what happens when the hype slows down.
ZCAT Is Up 35 Percent But The Reward Model Needs A Closer Look
ZCAT has suddenly attracted a lot of attention.
The token jumped around 35 percent in 24 hours and reached a market cap near $150M. Trading volume also reached around $40.9M.
But the price move is not the most interesting part for me.
The bigger story is the ZEC reward system.
ZCAT reportedly distributed around 2320 ZEC worth roughly $2.8M to holders.
The model is simple.
Every ZCAT transaction has a 3 percent fee. Most of that fee is used to buy ZEC. The ZEC is then distributed to eligible ZCAT holders.
That sounds attractive on the surface.
But there is an important catch.
The rewards depend on people continuing to trade and transfer ZCAT.
So the same activity that creates rewards also creates the fees needed to fund them.
If trading activity slows down then future rewards can also become smaller.
There is also a minimum holding requirement of around $20 worth of ZCAT.
The project says more than 470000 payments have already been made. But that does not mean 470000 different holders received rewards. One wallet can receive multiple payments.
This distinction matters when trying to judge actual adoption.
The price action itself is another warning.
ZCAT moved between roughly $0.090 and $0.175 in just 24 hours.
That is a massive range for a token that has only existed for a few days.
Anyone buying near the daily high could have faced a sharp loss shortly after.
For me the biggest question is sustainability.
The reward system can attract buyers while ZCAT activity remains high. But it still needs continuous trading activity to keep the system going.
The connection with ZEC is interesting because Zcash has also been performing strongly.
But a strong ZEC market does not automatically guarantee lasting demand for ZCAT.
Right now I would treat ZCAT as a highly speculative asset.
The reward model is interesting.
The early numbers are impressive.
But the token needs to prove that demand can survive after the initial excitement fades.
A 35 percent move looks great on the chart.
The real test is what happens when the hype slows down.
The token jumped around 35 percent in 24 hours and reached a market cap near $150M. Trading volume also reached around $40.9M.
But the price move is not the most interesting part for me.
The bigger story is the ZEC reward system.
ZCAT reportedly distributed around 2320 ZEC worth roughly $2.8M to holders.
The model is simple.
Every ZCAT transaction has a 3 percent fee. Most of that fee is used to buy ZEC. The ZEC is then distributed to eligible ZCAT holders.
That sounds attractive on the surface.
But there is an important catch.
The rewards depend on people continuing to trade and transfer ZCAT.
So the same activity that creates rewards also creates the fees needed to fund them.
If trading activity slows down then future rewards can also become smaller.
There is also a minimum holding requirement of around $20 worth of ZCAT.
The project says more than 470000 payments have already been made. But that does not mean 470000 different holders received rewards. One wallet can receive multiple payments.
This distinction matters when trying to judge actual adoption.
The price action itself is another warning.
ZCAT moved between roughly $0.090 and $0.175 in just 24 hours.
That is a massive range for a token that has only existed for a few days.
Anyone buying near the daily high could have faced a sharp loss shortly after.
For me the biggest question is sustainability.
The reward system can attract buyers while ZCAT activity remains high. But it still needs continuous trading activity to keep the system going.
The connection with ZEC is interesting because Zcash has also been performing strongly.
But a strong ZEC market does not automatically guarantee lasting demand for ZCAT.
Right now I would treat ZCAT as a highly speculative asset.
The reward model is interesting.
The early numbers are impressive.
But the token needs to prove that demand can survive after the initial excitement fades.
A 35 percent move looks great on the chart.
The real test is what happens when the hype slows down.
257
·
--

Статья
HYPE Has Strong Buying But The Chart Is Sending A WarningHYPE recently reached a new all time high near $89.
At first glance the setup still looks strong. But the chart is starting to show a different side.
The MACD has formed a death cross. This means the MACD line moved below its signal line and short term momentum is weakening.
This does not mean HYPE must crash.
The last similar signal in June was followed by a period of sideways trading rather than a major collapse.
That makes the $80 area very important for me now.
The interesting part is that spot buyers are still active.
Around $73.32M worth of HYPE was bought over the past 24 hours. Over the last seven days buyers purchased around $445M worth of HYPE.
At the same time around $4.54M worth of HYPE moved out of exchanges in the last 24 hours.
That tells me there is still real demand underneath the price.
But there is another warning coming from the derivatives market.
Long traders are already taking more damage than short traders. Around $225K in long positions were liquidated during the past day compared with only around $9.5K from shorts.
That is a big difference.
When long traders keep getting liquidated it can create additional selling pressure even when the longer term demand picture remains healthy.
So I would not look at the $445M buying figure and assume the downside risk is gone.
For me the next few days are about the battle between spot accumulation and short term selling.
If HYPE holds $80 while spot buying continues then the death cross could simply lead to consolidation before another attempt higher.
If $80 breaks and long liquidations accelerate then the recent all time high could start looking like a local top.
The buying activity is encouraging.
The technical signal is not.
Right now I would rather watch how HYPE reacts around $80 than chase the move after an $89 high.
HYPE Has Strong Buying But The Chart Is Sending A Warning
HYPE recently reached a new all time high near $89.
At first glance the setup still looks strong. But the chart is starting to show a different side.
The MACD has formed a death cross. This means the MACD line moved below its signal line and short term momentum is weakening.
This does not mean HYPE must crash.
The last similar signal in June was followed by a period of sideways trading rather than a major collapse.
That makes the $80 area very important for me now.
The interesting part is that spot buyers are still active.
Around $73.32M worth of HYPE was bought over the past 24 hours. Over the last seven days buyers purchased around $445M worth of HYPE.
At the same time around $4.54M worth of HYPE moved out of exchanges in the last 24 hours.
That tells me there is still real demand underneath the price.
But there is another warning coming from the derivatives market.
Long traders are already taking more damage than short traders. Around $225K in long positions were liquidated during the past day compared with only around $9.5K from shorts.
That is a big difference.
When long traders keep getting liquidated it can create additional selling pressure even when the longer term demand picture remains healthy.
So I would not look at the $445M buying figure and assume the downside risk is gone.
For me the next few days are about the battle between spot accumulation and short term selling.
If HYPE holds $80 while spot buying continues then the death cross could simply lead to consolidation before another attempt higher.
If $80 breaks and long liquidations accelerate then the recent all time high could start looking like a local top.
The buying activity is encouraging.
The technical signal is not.
Right now I would rather watch how HYPE reacts around $80 than chase the move after an $89 high.
At first glance the setup still looks strong. But the chart is starting to show a different side.
The MACD has formed a death cross. This means the MACD line moved below its signal line and short term momentum is weakening.
This does not mean HYPE must crash.
The last similar signal in June was followed by a period of sideways trading rather than a major collapse.
That makes the $80 area very important for me now.
The interesting part is that spot buyers are still active.
Around $73.32M worth of HYPE was bought over the past 24 hours. Over the last seven days buyers purchased around $445M worth of HYPE.
At the same time around $4.54M worth of HYPE moved out of exchanges in the last 24 hours.
That tells me there is still real demand underneath the price.
But there is another warning coming from the derivatives market.
Long traders are already taking more damage than short traders. Around $225K in long positions were liquidated during the past day compared with only around $9.5K from shorts.
That is a big difference.
When long traders keep getting liquidated it can create additional selling pressure even when the longer term demand picture remains healthy.
So I would not look at the $445M buying figure and assume the downside risk is gone.
For me the next few days are about the battle between spot accumulation and short term selling.
If HYPE holds $80 while spot buying continues then the death cross could simply lead to consolidation before another attempt higher.
If $80 breaks and long liquidations accelerate then the recent all time high could start looking like a local top.
The buying activity is encouraging.
The technical signal is not.
Right now I would rather watch how HYPE reacts around $80 than chase the move after an $89 high.
213
Войдите, чтобы посмотреть больше материала
Присоединяйтесь к пользователям криптовалют по всему миру на Binance Square
⚡️ Получайте новейшую и полезную информацию о криптоактивах.
💬 Нам доверяет крупнейшая в мире криптобиржа.
👍 Получите достоверные аналитические данные от верифицированных создателей контента.
Эл. почта/номер телефона
В тренде
USAugustPPIRisesLessThanExpected
Просмотров: 2,698
124 обсуждают
🚨 US AUG PPI: Rises LESS Than Expected! Bullish for Crypto? 🚀
PPI +0.4% MoM as expected, but CORE PPI only +0.2% vs +0.3% expected - cooling!
What it means:
• Wholesale inflation softer than feared
• Fed rate hike chance now 62% - but dovish signals coming
• Core PCE revisions expected downward - bullish
• BTC usually pumps on softer PPI
Fed meeting Sep 15-16 - Market now expects pause, not hike?
Is this the green light for Q4 rally?
#Bitcoin #PPI #Fed #CryptoNews #BTC#usaugustppiriseslessthanexpected
True News
·Лайков: 1
·Просмотров: 699
SECApprovesNasdaqTexasCommodityTrustRule
Просмотров: 3,729
176 обсуждают
ECBRaisesRatesSecondTimeTo2.5%
Просмотров: 1,812
122 обсуждают