$SUI — FROM $5.38 TO $0.76… BUT IS THE STORY OVER?
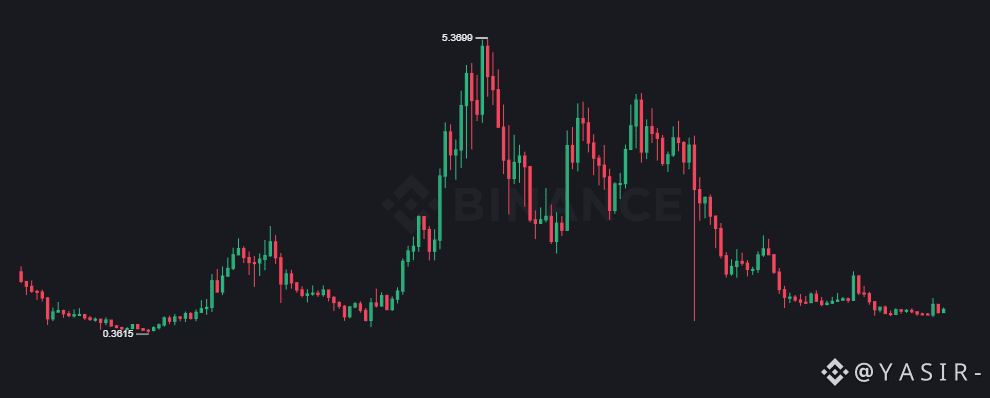
Looking at the bigger picture of $SUI, this chart is honestly a roller coaster. After reaching around $5.38, SUI went through a massive correction and has spent a long time grinding lower, eventually coming back toward the $0.76 area. But this is where the interesting part begins: when a coin falls this far from its previous peak and then spends months moving sideways, the market can eventually reach a point where even a small shift in demand can create a much bigger move. the current chart is definitely something I would keep on my radar. If buyers start building a proper higher-low structure and volume returns, SUI could slowly change its character from “forgotten coin” to “why is SUI suddenly pumping?”
And if the broader crypto market turns strongly bullish, that could make the recovery even more interesting. watch for the structure to change first. $SUI has already shown that it can move hard… the question is whether it can surprise the market again.🔥
👇
Looking at the bigger picture of $SUI, this chart is honestly a roller coaster. After reaching around $5.38, SUI went through a massive correction and has spent a long time grinding lower, eventually coming back toward the $0.76 area. But this is where the interesting part begins: when a coin falls this far from its previous peak and then spends months moving sideways, the market can eventually reach a point where even a small shift in demand can create a much bigger move. the current chart is definitely something I would keep on my radar. If buyers start building a proper higher-low structure and volume returns, SUI could slowly change its character from “forgotten coin” to “why is SUI suddenly pumping?”
And if the broader crypto market turns strongly bullish, that could make the recovery even more interesting. watch for the structure to change first. $SUI has already shown that it can move hard… the question is whether it can surprise the market again.🔥
👇