$ENA Latest Market Update & Trade Plan🤫
📌 Trading Plan (Long Setup):
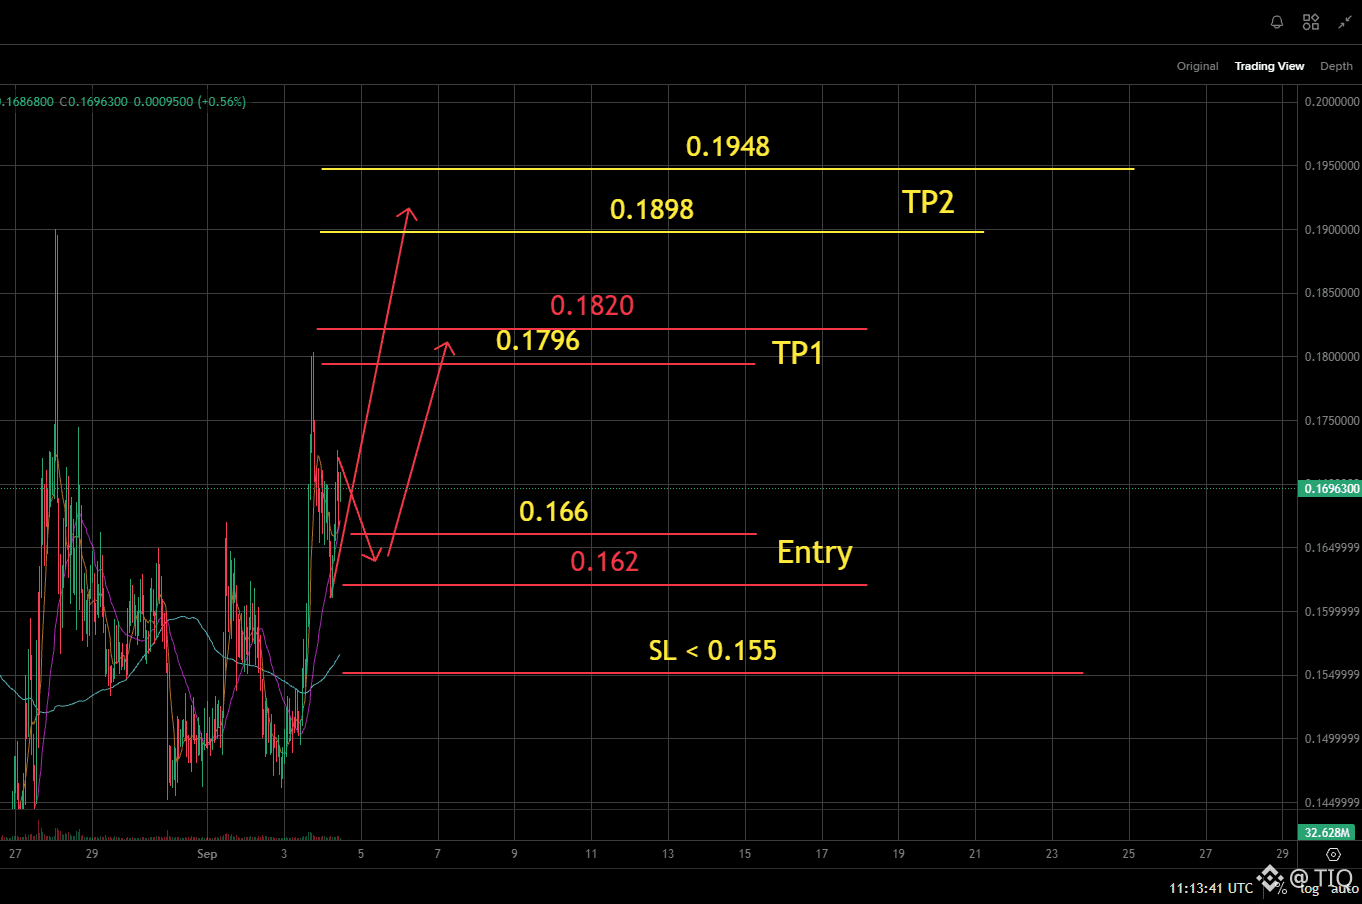
👉 Long Entry Zone: 0.162 - 0.166
💥 Stop Loss (SL): < 0.155
🎉 TP1: 0.1796 - 0.1820
🎉 TP2: 0.1898 - 0.1948
💥 Price is currently trading around 0.1696 On the H1 chart, price printed a strong bullish impulse wave out of the 0.1450 demand base and is now consolidating near local highs. The technical setup anticipates a controlled pullback into key support to test buyers' strength and establish a solid higher low before resuming its aggressive upward rally toward higher resistance targets
👉 Following a successful sweep of lower liquidity near ~0.145, price launched a sharp vertical expansion toward ~0.180. The current retracement is expected to form a secondary higher low structure within the underlying demand zone, setting the foundation for the next bullish leg higher
👉 The primary entry confluence zone lies between 0.162 and 0.166. Waiting for price to dip into this demand block offers an optimal risk to reward ratio for Long positioning as buyers defend structural support
👉 Key Invalidation (SL): A clean breakdown and candle close below 0.155 invalidates this Long thesis, signaling structural failure and potential for a deeper market correction.
Click here to view the chart 👇️👇👇
📌 Trading Plan (Long Setup):
👉 Long Entry Zone: 0.162 - 0.166
💥 Stop Loss (SL): < 0.155
🎉 TP1: 0.1796 - 0.1820
🎉 TP2: 0.1898 - 0.1948
💥 Price is currently trading around 0.1696 On the H1 chart, price printed a strong bullish impulse wave out of the 0.1450 demand base and is now consolidating near local highs. The technical setup anticipates a controlled pullback into key support to test buyers' strength and establish a solid higher low before resuming its aggressive upward rally toward higher resistance targets
👉 Following a successful sweep of lower liquidity near ~0.145, price launched a sharp vertical expansion toward ~0.180. The current retracement is expected to form a secondary higher low structure within the underlying demand zone, setting the foundation for the next bullish leg higher
👉 The primary entry confluence zone lies between 0.162 and 0.166. Waiting for price to dip into this demand block offers an optimal risk to reward ratio for Long positioning as buyers defend structural support
👉 Key Invalidation (SL): A clean breakdown and candle close below 0.155 invalidates this Long thesis, signaling structural failure and potential for a deeper market correction.
Click here to view the chart 👇️👇👇