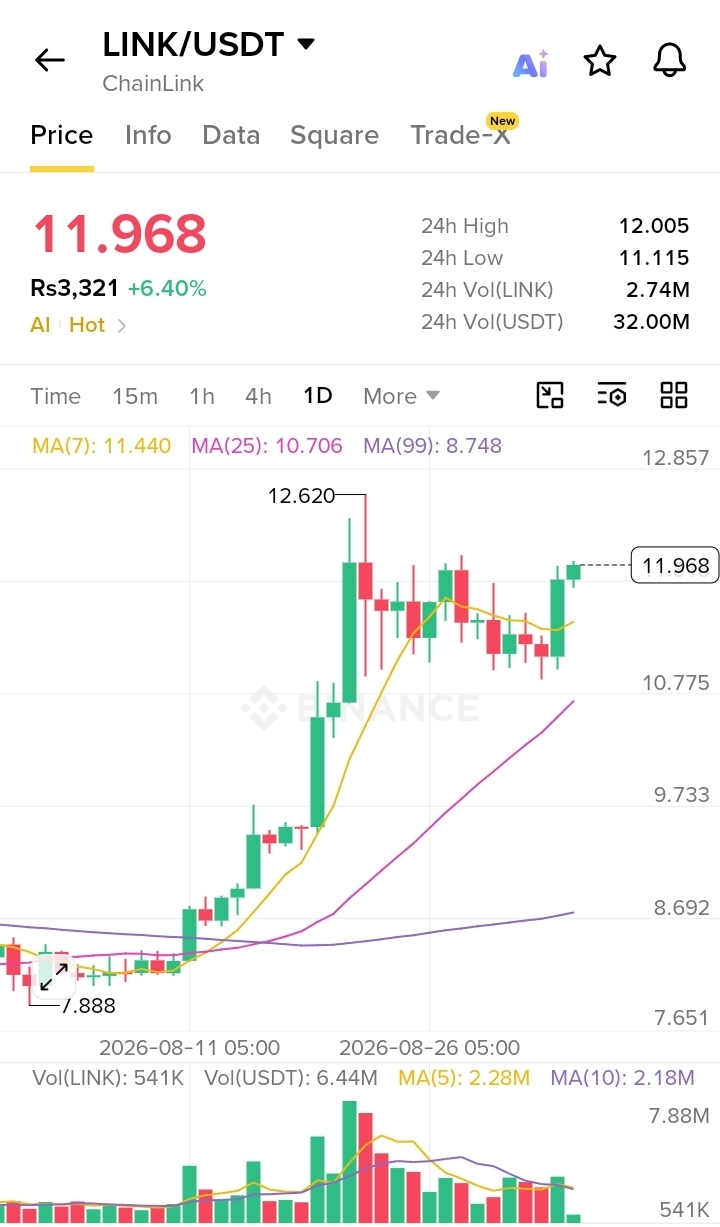
🚀 $LINK /USDT 1D Technical Analysis: Bullish Momentum Resuming After Consolidation! 🚀
$LINK is showing strong macro strength on the daily chart, currently trading at $11.968 (+6.40%) as buyers push back up toward key resistance levels after holding above the key moving averages. Here is a breakdown of the daily timeframe structure.
--------------------------------------------------
📊 KEY CHART HIGHLIGHTS
• Current Price: $11.968
• Moving Average Alignment (1D):
- MA(7) [Yellow]: $11.440 – Immediate dynamic daily support.
- MA(25) [Pink]: $10.706 – Key medium-term trend line, currently supporting higher lows.
- MA(99) [Purple]: $8.748 – Strong macro foundation indicator far below current price action.
• Price Action: After pulling back from the local high of $12.620, LINK consolidated and formed a solid higher low structure before printing a new green expansion daily candle.
--------------------------------------------------
🎯 KEY LEVELS TO WATCH
• Resistance Zones:
- $12.000 – $12.050: Immediate psychological hurdle (24h high at $12.005).
- $12.620: Primary local swing high / major resistance level.
- $13.500: Higher target zone upon breakout confirmation.
• Support Zones:
- $11.440: First dynamic support (aligned with 7 MA).
- $10.700 – $10.775: Strong horizontal & dynamic support (aligned with 25 MA).
- $8.750: Major long-term trend support (99 MA).
--------------------------------------------------
💡 TRADE SETUP IDEAS
🟢 Strategy A: Retest / Pullback Entry (Low Risk)
• Entry Zone: $11.400 – $11.600 (Near daily 7 MA support)
• Targets:
- 🎯 TP1: $12.000
- 🎯 TP2: $12.600
- 🎯 TP3: $13.200
• Stop-Loss (SL): $10.600 (Below 25 MA support)
🔵 Strategy B: Breakout Continuation (Momentum)
• Entry: Confirmed daily candle close above $12.050
• Targets:
- 🎯 TP1: $12.620
- 🎯 TP2: $13.500
• Stop-Loss (SL): $11.350
--------------------------------------------------
⚠️ Disclaimer: Not financial advice. Always do your own research (DYOR) and manage your risk carefully!
#LINK #Chainlink #USDT #CryptoTradin #TechnicalAnalysis