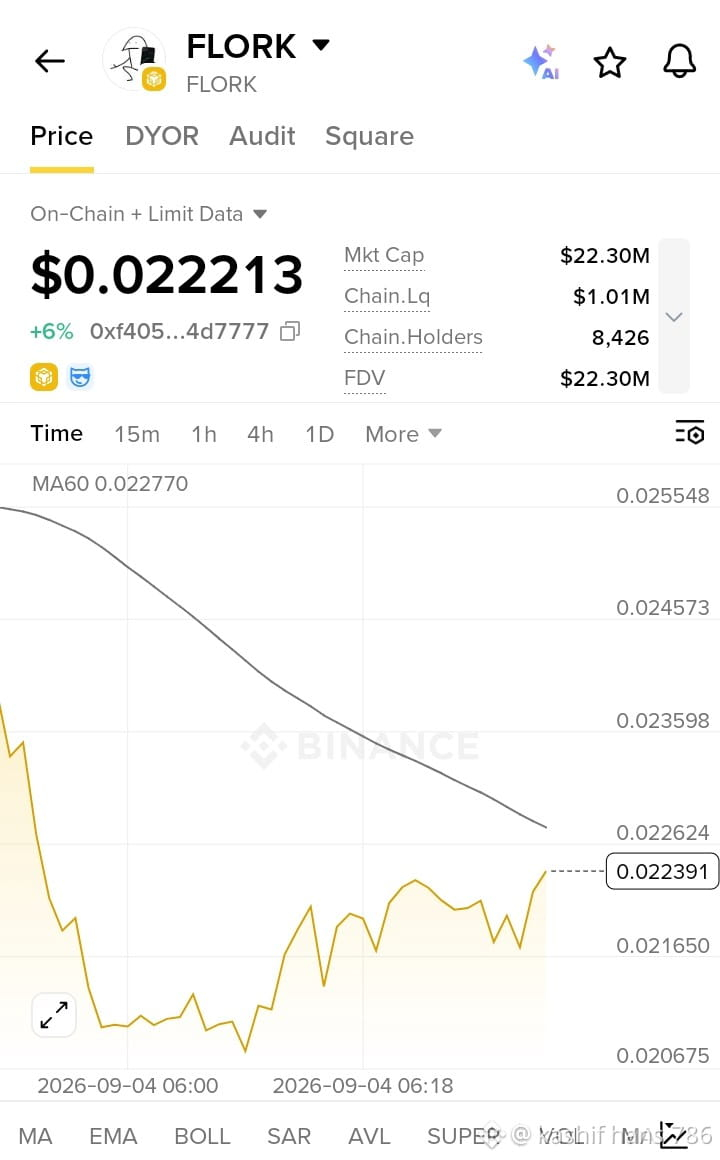
,$FLORK is showing short-term bullish momentum, but it’s still below the MA60.
Current: $0.022213, about +6%
MA60: $0.022770 → immediate resistance
Resistance: $0.02262–$0.02277, then $0.02360
Higher resistance: $0.02457–$0.02555
Support: $0.0220, then $0.02165
Major support: around $0.02068
Chart read: A clean move above $0.02277 with strong volume would improve the bullish setup. If price is rejected there, a pullback toward $0.0220–$0.02165 is possible.
Note: live sources show different FLORK prices because there are multiple assets/tokens using the FLORK ticker, so your 0xf405… contract/chart data should be treated as the reference for this analysis.
If you want, I can also .map this into **Entry / Targets / Stop-loss** based strictly on the levels in your screenshot
Current: $0.022213, about +6%
MA60: $0.022770 → immediate resistance
Resistance: $0.02262–$0.02277, then $0.02360
Higher resistance: $0.02457–$0.02555
Support: $0.0220, then $0.02165
Major support: around $0.02068
Chart read: A clean move above $0.02277 with strong volume would improve the bullish setup. If price is rejected there, a pullback toward $0.0220–$0.02165 is possible.
Note: live sources show different FLORK prices because there are multiple assets/tokens using the FLORK ticker, so your 0xf405… contract/chart data should be treated as the reference for this analysis.
If you want, I can also .map this into **Entry / Targets / Stop-loss** based strictly on the levels in your screenshot