$ETH Ethereum (ETH) Technical Analysis
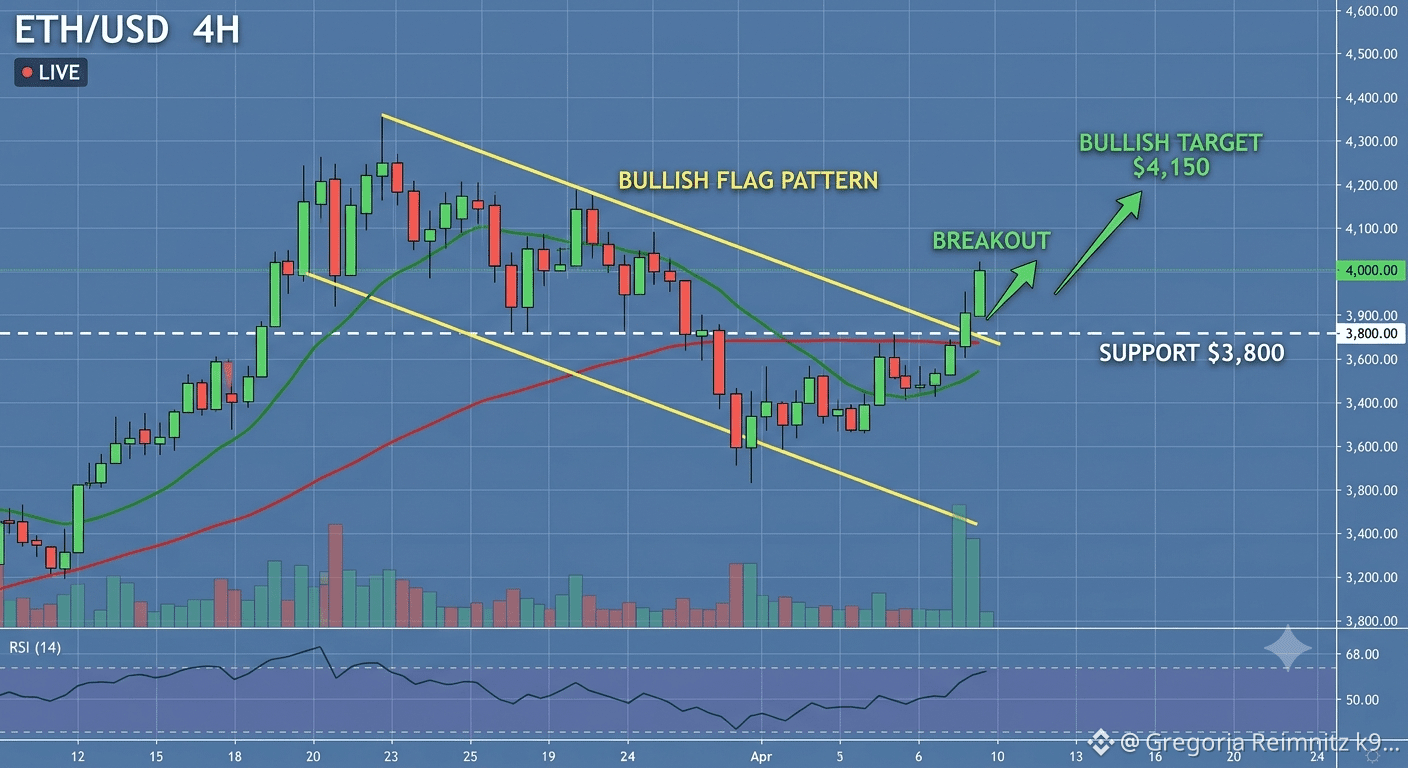
The 4-hour chart for ETH/USD is currently displaying a significant bullish technical structure. Following a period of consolidation, Ethereum has successfully broken out of a Bullish Flag pattern, a formation typically associated with strong continuation moves following a prior uptrend (the 'flagpole').
Key Levels and Indicators
Pattern Breakout: The primary signal is the breakout above the upper trendline resistance of the flag, which occurred near the $3,800 level. This breakout is supported by a notable increase in trading volume, confirming buyer strength.
Support & Resistance:
Immediate Support: The breakout point near $3,800 is now expected to act as immediate support on any potential retests. Stronger horizontal support is found around $3,650.
Near-Term Resistance: A psychological resistance level is approaching at $4,000.
Bullish Target: Based on technical measuring techniques for the flag pattern, the projected target for this move is approximately $4,150.
Moving Averages: The 20-period Moving Average (green line) is crossing above the 50-period Moving Average (red line). This 'golden cross' on the 4-hour timeframe reinforces the bullish momentum in the short term.
RSI: The Relative Strength Index (RSI) is currently near 68, indicating strong positive momentum but still allowing room before entering deeply overbought territory (above 70).
Outlook
As long as Ethereum remains above the $3,800 support level, the technical outlook remains firmly bullish. The structure points toward a likely test of $4,000 and a potential run toward the pattern's measured target of $4,150. Traders will closely monitor if this momentum can overcome the significant hurdle at $4,000.
Technical Chart (4-Hour Timeframe
#Ethereum✅ #EthereumNews
The 4-hour chart for ETH/USD is currently displaying a significant bullish technical structure. Following a period of consolidation, Ethereum has successfully broken out of a Bullish Flag pattern, a formation typically associated with strong continuation moves following a prior uptrend (the 'flagpole').
Key Levels and Indicators
Pattern Breakout: The primary signal is the breakout above the upper trendline resistance of the flag, which occurred near the $3,800 level. This breakout is supported by a notable increase in trading volume, confirming buyer strength.
Support & Resistance:
Immediate Support: The breakout point near $3,800 is now expected to act as immediate support on any potential retests. Stronger horizontal support is found around $3,650.
Near-Term Resistance: A psychological resistance level is approaching at $4,000.
Bullish Target: Based on technical measuring techniques for the flag pattern, the projected target for this move is approximately $4,150.
Moving Averages: The 20-period Moving Average (green line) is crossing above the 50-period Moving Average (red line). This 'golden cross' on the 4-hour timeframe reinforces the bullish momentum in the short term.
RSI: The Relative Strength Index (RSI) is currently near 68, indicating strong positive momentum but still allowing room before entering deeply overbought territory (above 70).
Outlook
As long as Ethereum remains above the $3,800 support level, the technical outlook remains firmly bullish. The structure points toward a likely test of $4,000 and a potential run toward the pattern's measured target of $4,150. Traders will closely monitor if this momentum can overcome the significant hurdle at $4,000.
Technical Chart (4-Hour Timeframe
#Ethereum✅ #EthereumNews