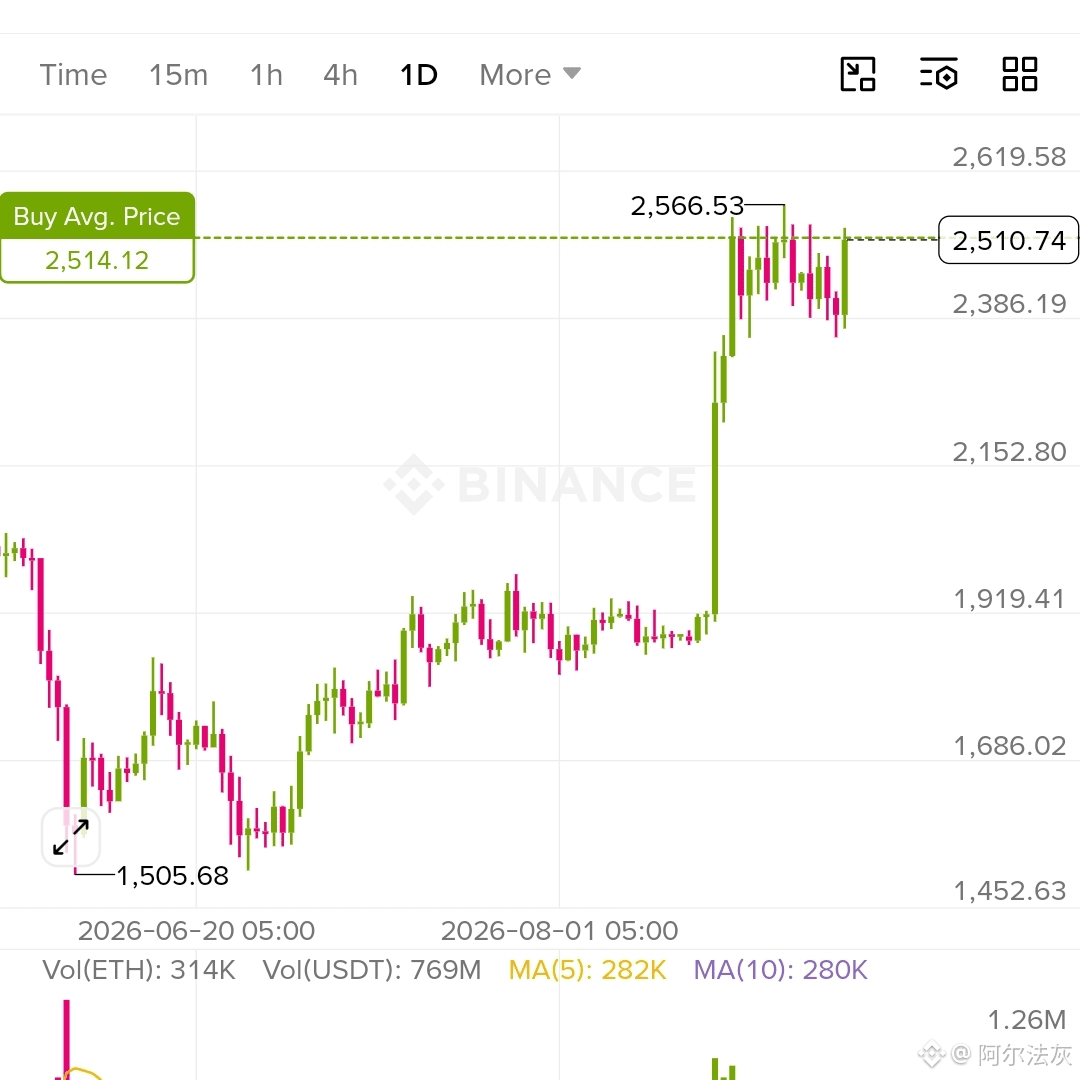
ETH's daily chart tells a bigger story here, from that 1,505 low all the way up through consolidation near 1,900, then this massive breakout candle straight to 2,566 recently.
what's interesting is it's now pulled back to sit almost exactly at that 2,514 average buy price shown on the chart, kind of a natural spot for things to pause since so many positions are stacked right around there.
order book's leaning heavy green too, 71% buy side, fits with dips getting bought near this zone rather than sold into.
$ETH
Entry: 2,470 – 2,530
TP: 2,566 / 2,700
SL: 2,300
2,386's the level i'd watch below, that's roughly the top of the pre-breakout consolidation now acting as support. lose that with real pressure and i'd treat this breakout as needing way more time to work out
what's interesting is it's now pulled back to sit almost exactly at that 2,514 average buy price shown on the chart, kind of a natural spot for things to pause since so many positions are stacked right around there.
order book's leaning heavy green too, 71% buy side, fits with dips getting bought near this zone rather than sold into.
$ETH
Entry: 2,470 – 2,530
TP: 2,566 / 2,700
SL: 2,300
2,386's the level i'd watch below, that's roughly the top of the pre-breakout consolidation now acting as support. lose that with real pressure and i'd treat this breakout as needing way more time to work out