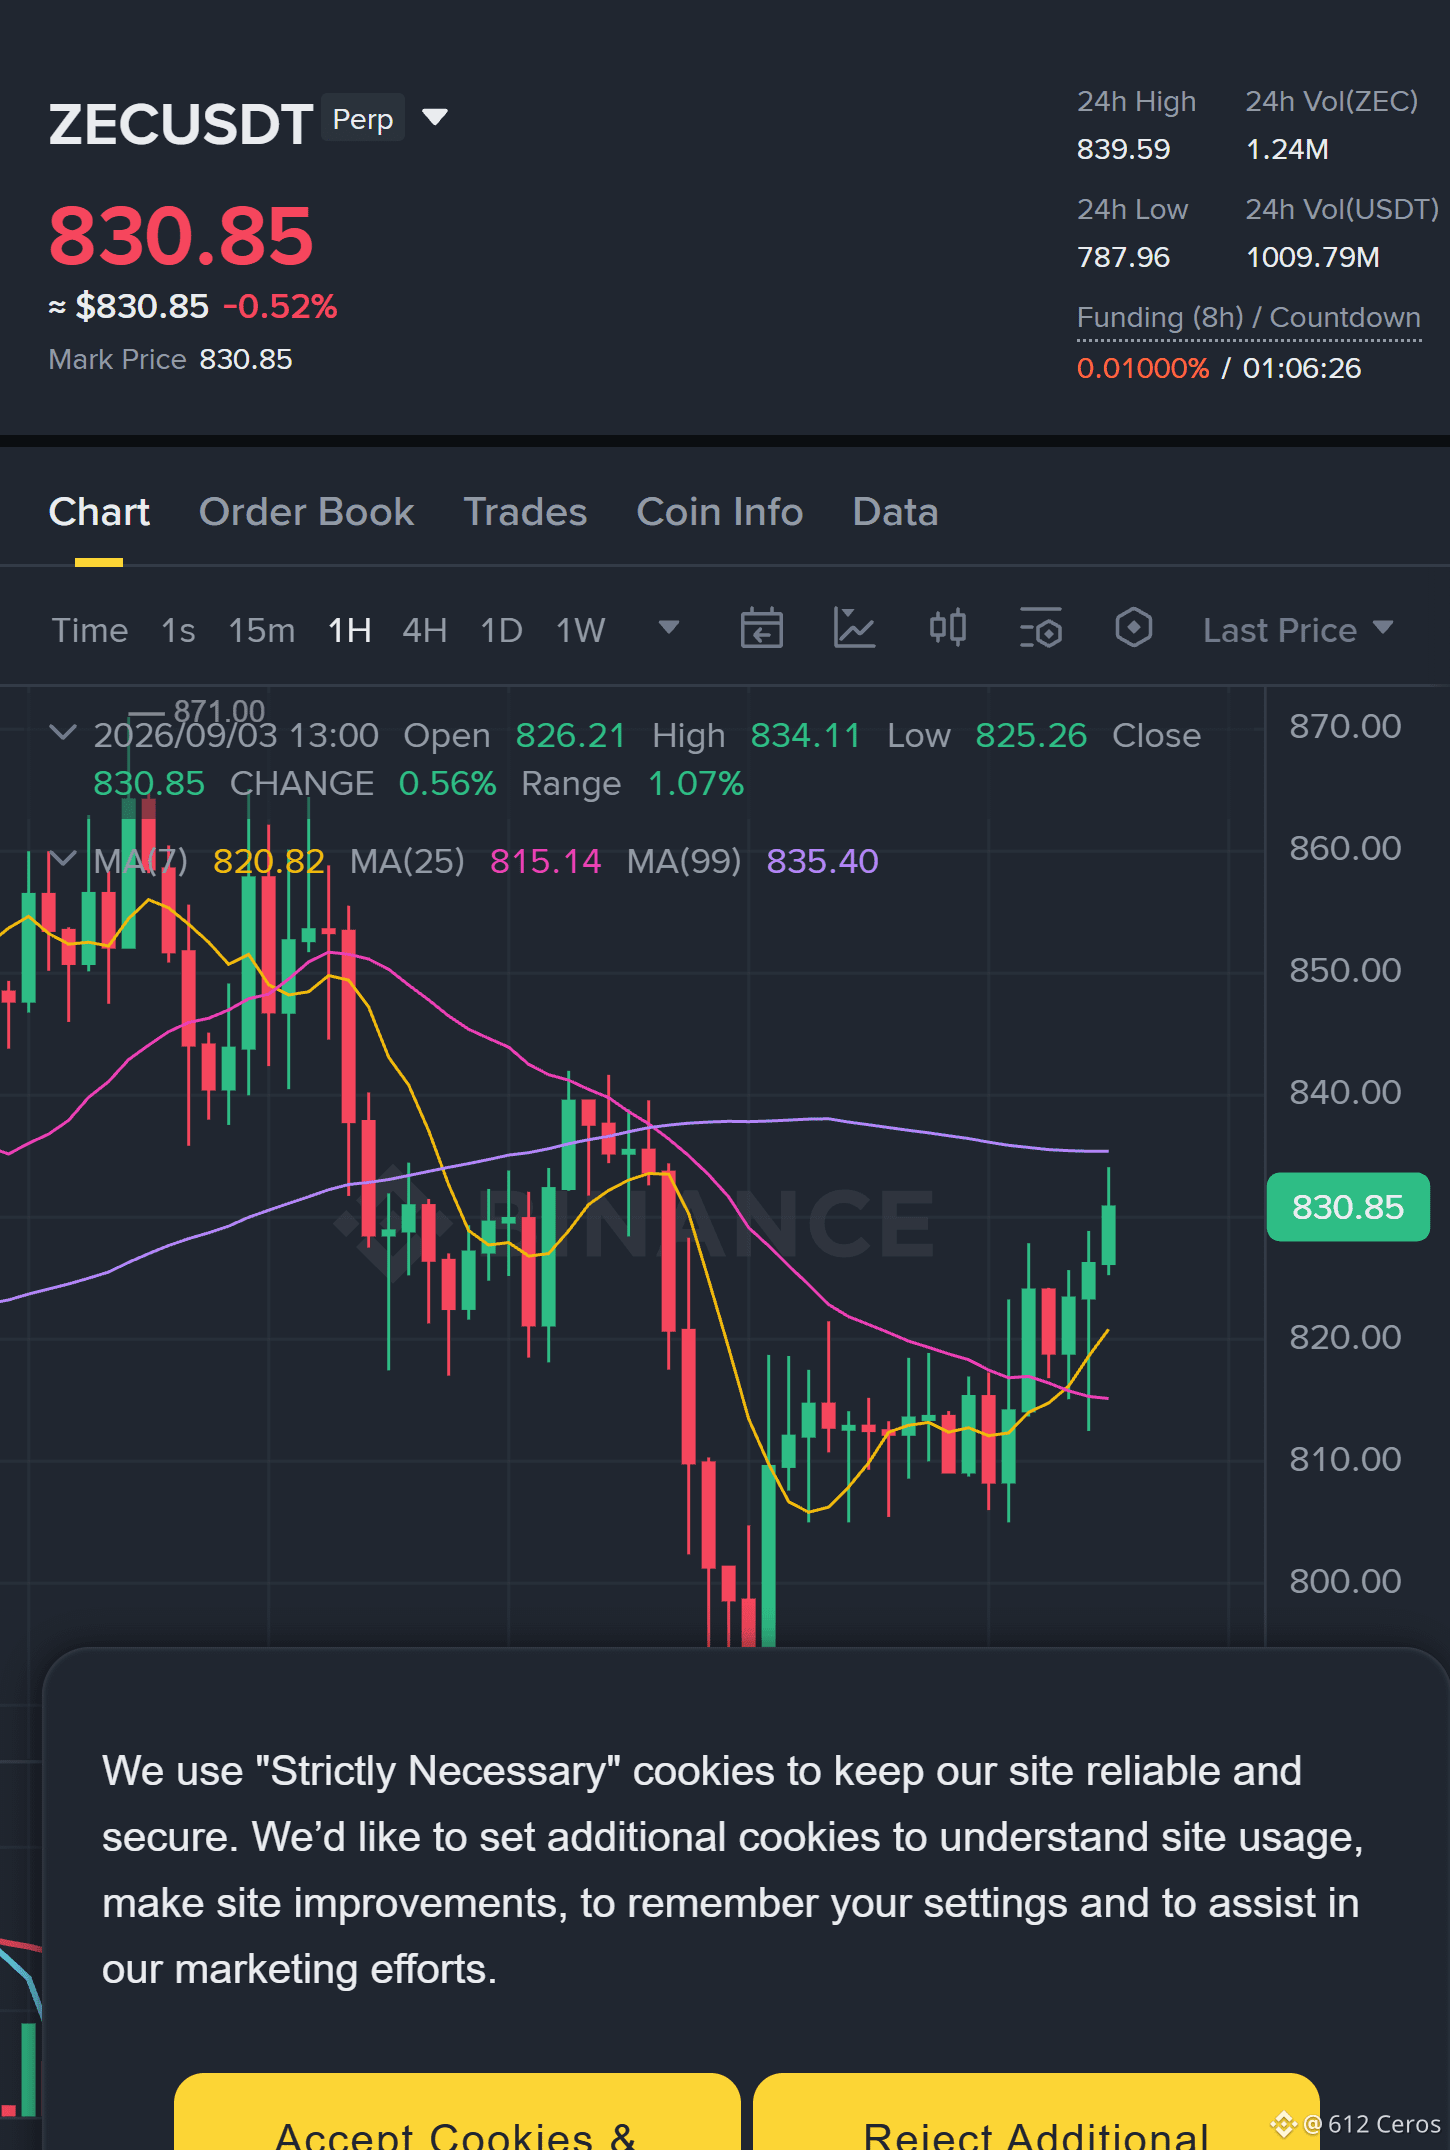
Everyone is staring at the 1-hour chart, but the daily tape is whispering a different secret about ZEC.
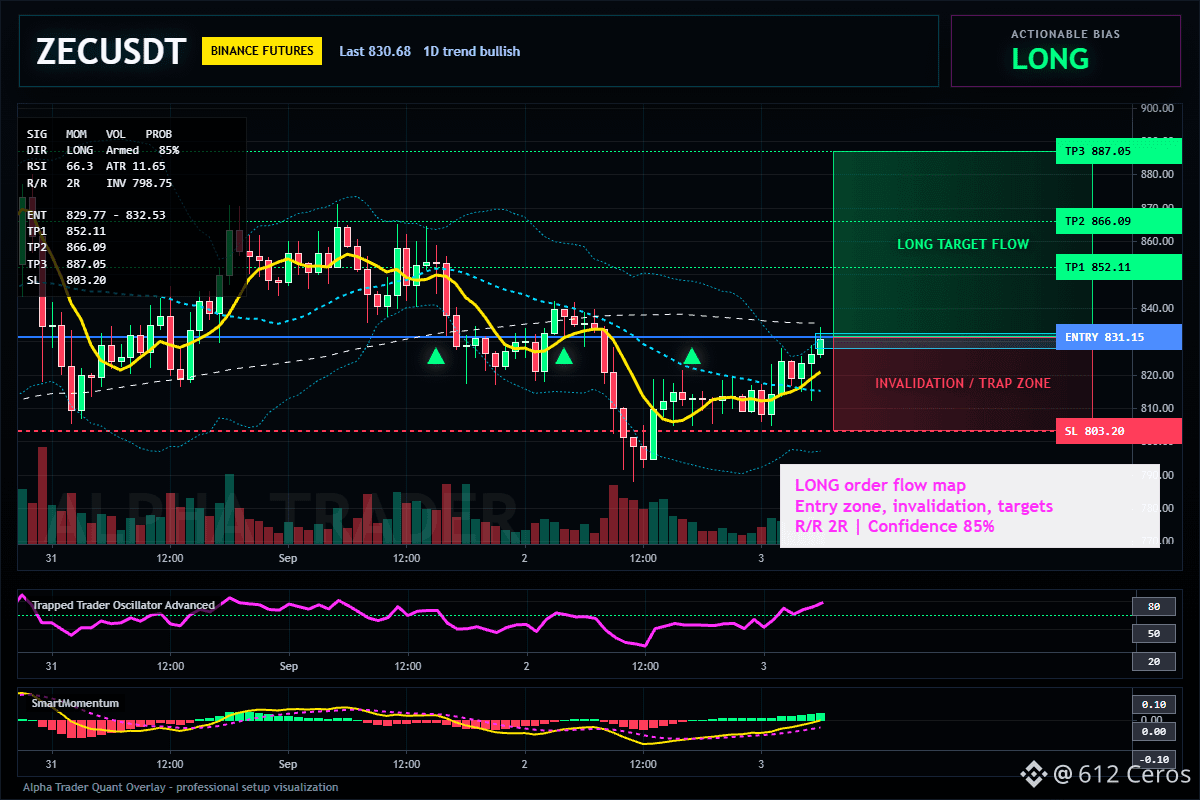
$ZEC /USDT - 🟢 LONG · Conf 84%
Trade Plan:
Entry: 829.77 – 832.53
SL: 803.20
TP1: 852.11
TP2: 866.09
TP3: 887.05
Why this setup?
- The 4h structure is holding a bullish trend, and price is coiling right at the 831.15 reference zone.
- RSI on the 15m sits at 66.31, meaning momentum is warm but not yet overheated—there is still room to run before exhaustion.
- The immediate target ladder is clear: 852.11, then 866.09, with the big prize at 887.05.
- Why now? The daily trend is bullish, and this is a trend-following setup, not a counter-trend gamble. The stop at 803.20 gives you a defined risk of roughly 3.4% against a potential 6.7% move to TP1.
- This is a trend regime play, so the bias aligns with the higher timeframe—no reversal warning needed here. The edge is in the confluence of the 4h trend and the 1h consolidation breakout.
Debate:
If price tags 852.11, do you bank the partial or let it all ride toward 887.05?
Click here to view the chart 👇️
⚠️ Personal market analysis only. NFA — manage risk and DYOR.
Educational content, not investment advice or a recommendation to buy, sell, deposit, or withdraw any asset. No paid promotion or referral/affiliate links.
$ZEC /USDT - 🟢 LONG · Conf 84%
Trade Plan:
Entry: 829.77 – 832.53
SL: 803.20
TP1: 852.11
TP2: 866.09
TP3: 887.05
Why this setup?
- The 4h structure is holding a bullish trend, and price is coiling right at the 831.15 reference zone.
- RSI on the 15m sits at 66.31, meaning momentum is warm but not yet overheated—there is still room to run before exhaustion.
- The immediate target ladder is clear: 852.11, then 866.09, with the big prize at 887.05.
- Why now? The daily trend is bullish, and this is a trend-following setup, not a counter-trend gamble. The stop at 803.20 gives you a defined risk of roughly 3.4% against a potential 6.7% move to TP1.
- This is a trend regime play, so the bias aligns with the higher timeframe—no reversal warning needed here. The edge is in the confluence of the 4h trend and the 1h consolidation breakout.
Debate:
If price tags 852.11, do you bank the partial or let it all ride toward 887.05?
Click here to view the chart 👇️
⚠️ Personal market analysis only. NFA — manage risk and DYOR.
Educational content, not investment advice or a recommendation to buy, sell, deposit, or withdraw any asset. No paid promotion or referral/affiliate links.