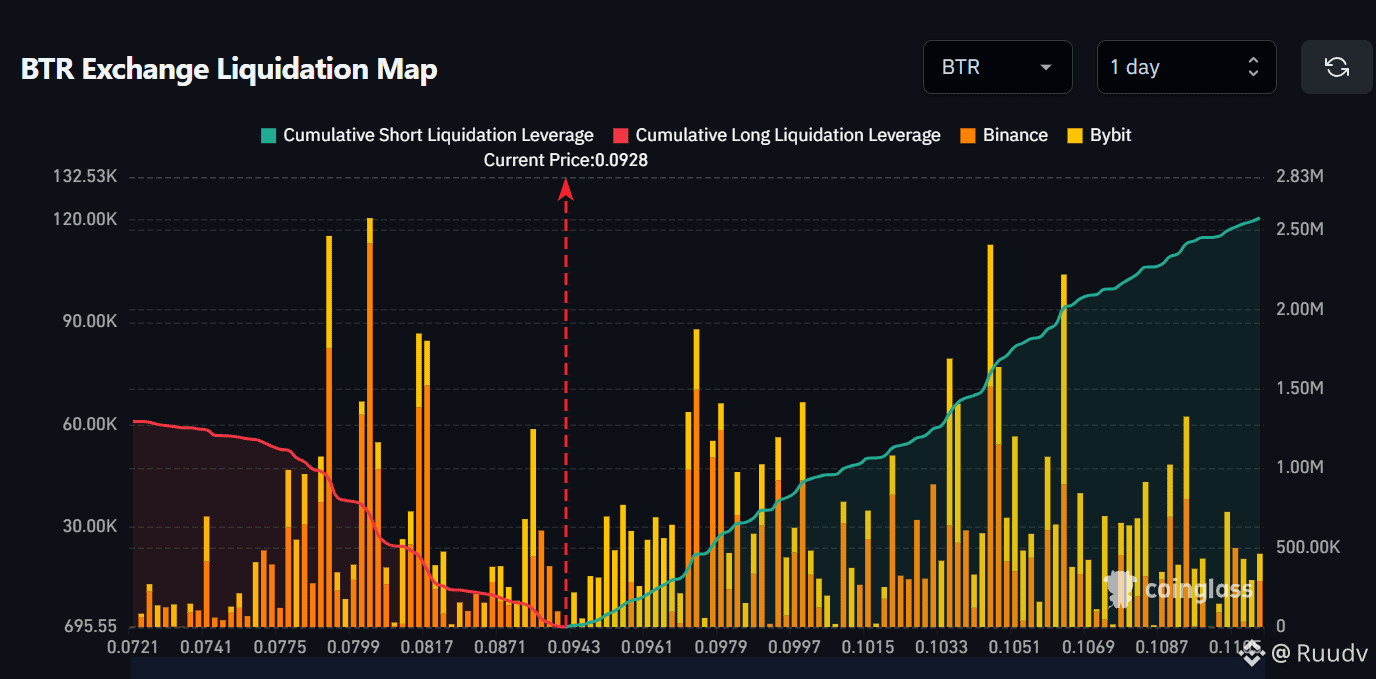
BTR Liquidation Map Analysis (Cross-Exchange: Binance & Bybit) — Current Price: $0.0928
Data structure:
The red line (short liquidation) declines from ~60K at $0.0721 down sharply to near $0 around $0.0871-0.0928 — indicating most short positions have already been liquidated below the current price, with relatively thin short liquidity remaining. The green line (long liquidation) starts climbing consistently after $0.0928 and keeps rising sharply to $2.5M in the $0.1087-0.1105 range — signaling a large buildup of leveraged long positions above the current price.
Liquidity cluster zones:
The highest cluster on the short side is at $0.0799-0.0817 (orange/Binance bars reaching ~120K), but this is well below the current price, so the risk of it being retriggered is now low. On the long side, significant clusters repeatedly appear at $0.0961, $0.0979, $0.1033, $0.1051, and $0.1069 — with the highest spikes at $0.1051 (~95K) and $0.1069 (~85K), dominated by Bybit (yellow).
Brief interpretation:
Low short squeeze risk — short liquidity below the current price has largely been used up, so upward pressure from a short squeeze is likely limited. Rising long liquidation risk above $0.0928 — the closer price moves toward $0.10-0.11, the denser the leveraged long buildup becomes, which could trigger a liquidation cascade if price rises further and then reverses down. The $0.1051 and $0.1069 levels stand out as price "magnet" zones due to the high concentration of liquidations there. #dyor $BTR
Data structure:
The red line (short liquidation) declines from ~60K at $0.0721 down sharply to near $0 around $0.0871-0.0928 — indicating most short positions have already been liquidated below the current price, with relatively thin short liquidity remaining. The green line (long liquidation) starts climbing consistently after $0.0928 and keeps rising sharply to $2.5M in the $0.1087-0.1105 range — signaling a large buildup of leveraged long positions above the current price.
Liquidity cluster zones:
The highest cluster on the short side is at $0.0799-0.0817 (orange/Binance bars reaching ~120K), but this is well below the current price, so the risk of it being retriggered is now low. On the long side, significant clusters repeatedly appear at $0.0961, $0.0979, $0.1033, $0.1051, and $0.1069 — with the highest spikes at $0.1051 (~95K) and $0.1069 (~85K), dominated by Bybit (yellow).
Brief interpretation:
Low short squeeze risk — short liquidity below the current price has largely been used up, so upward pressure from a short squeeze is likely limited. Rising long liquidation risk above $0.0928 — the closer price moves toward $0.10-0.11, the denser the leveraged long buildup becomes, which could trigger a liquidation cascade if price rises further and then reverses down. The $0.1051 and $0.1069 levels stand out as price "magnet" zones due to the high concentration of liquidations there. #dyor $BTR