
🚨 $BTR USDT — Bitlayer is showing a serious battle after a sharp drop
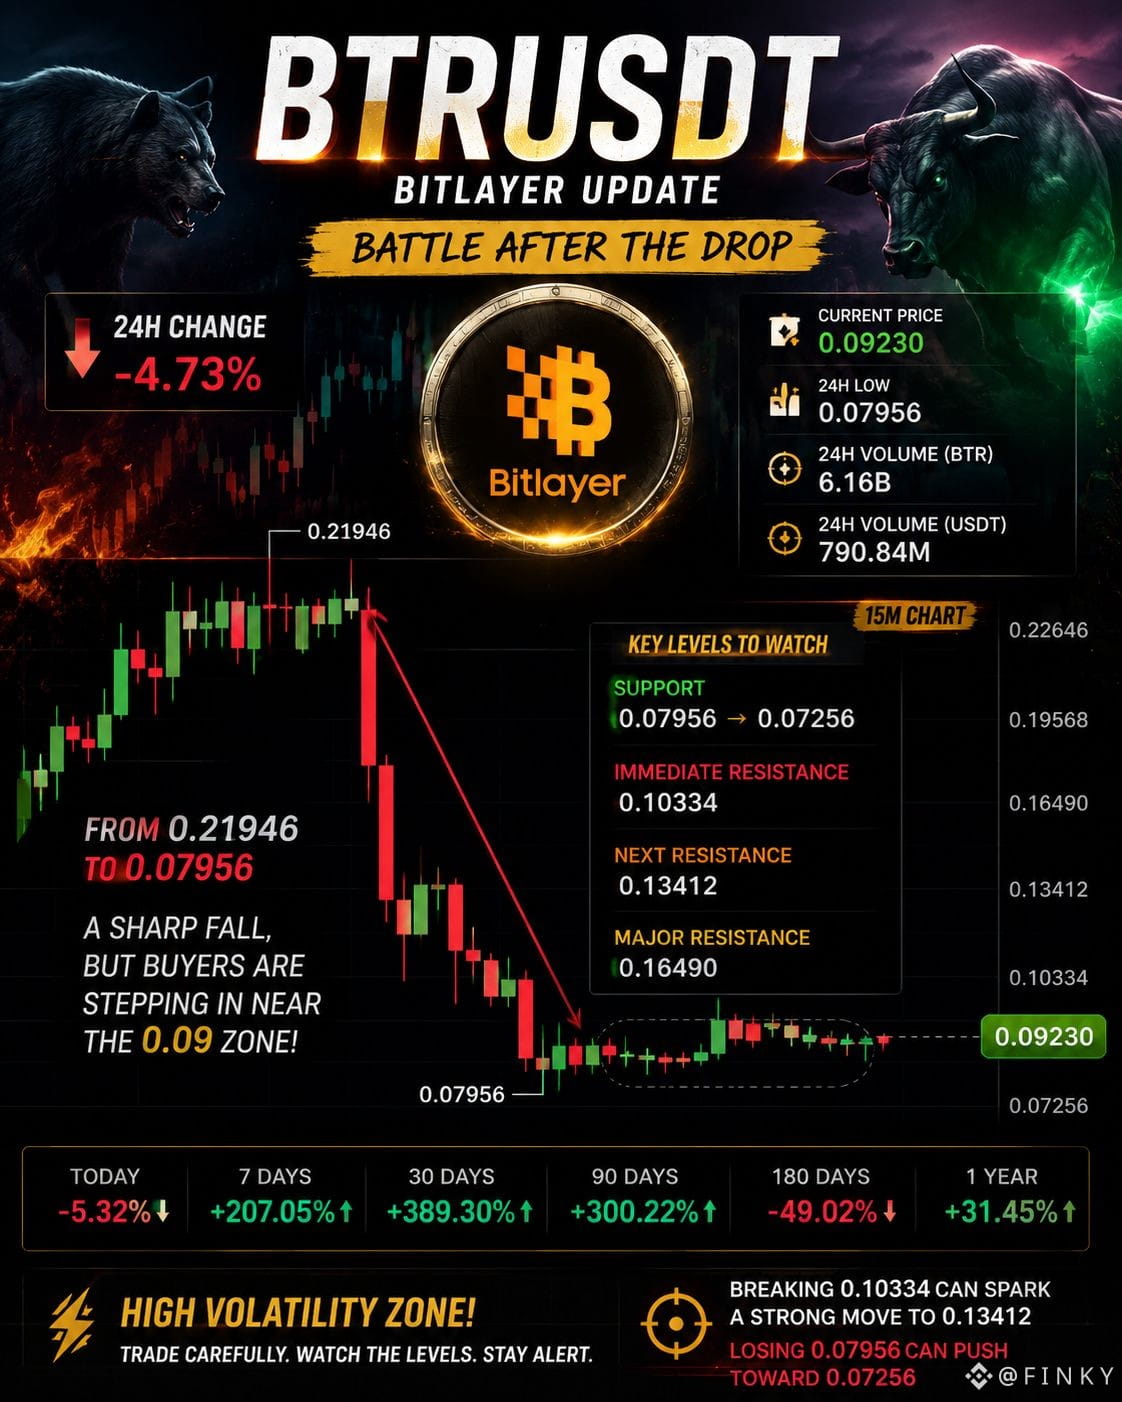
BTR has taken a heavy hit on the 15M chart, falling from around 0.21946 to a low of 0.07956. That is a major move, but buyers are now trying to build a base around the 0.09 area.
Current price: 0.09230
24H change: -4.73%
24H low: 0.07956
24H volume: 6.16B BTR
Volume in USDT: $790.84M
The interesting part is the reaction from 0.07956. Price has started moving sideways instead of continuing the free fall, showing that sellers may be losing some pressure.
📌 Key levels to watch
Support: 0.07956 → 0.07256
Immediate resistance: 0.10334
Next resistance: 0.13412
Major resistance: 0.16490
A clean reclaim of 0.10334 with strong volume could give BTR room to push toward 0.13412. If buyers manage to reclaim that zone too, the chart could start looking much stronger.
But losing 0.07956 would be a warning sign and could open the door toward the 0.07256 area.
The bigger picture is wild: BTR is showing +207.05% over 7 days, +389.30% over 30 days, and +300.22% over 90 days, despite the recent sharp correction.
Right now, this is a high-volatility zone. The next breakout or breakdown could move fast. Watch volume, support, and the 0.10334 resistance closely. ⚡
#ARBRises30%OnRobinhoodChainRevenue #Japan10YYieldHits3%FirstSince1996 #EtherETFsExtendInflowStreakTo11Days #GoldFalls5.5%From3MonthHigh #HangSengFalls1%
BTR has taken a heavy hit on the 15M chart, falling from around 0.21946 to a low of 0.07956. That is a major move, but buyers are now trying to build a base around the 0.09 area.
Current price: 0.09230
24H change: -4.73%
24H low: 0.07956
24H volume: 6.16B BTR
Volume in USDT: $790.84M
The interesting part is the reaction from 0.07956. Price has started moving sideways instead of continuing the free fall, showing that sellers may be losing some pressure.
📌 Key levels to watch
Support: 0.07956 → 0.07256
Immediate resistance: 0.10334
Next resistance: 0.13412
Major resistance: 0.16490
A clean reclaim of 0.10334 with strong volume could give BTR room to push toward 0.13412. If buyers manage to reclaim that zone too, the chart could start looking much stronger.
But losing 0.07956 would be a warning sign and could open the door toward the 0.07256 area.
The bigger picture is wild: BTR is showing +207.05% over 7 days, +389.30% over 30 days, and +300.22% over 90 days, despite the recent sharp correction.
Right now, this is a high-volatility zone. The next breakout or breakdown could move fast. Watch volume, support, and the 0.10334 resistance closely. ⚡
#ARBRises30%OnRobinhoodChainRevenue #Japan10YYieldHits3%FirstSince1996 #EtherETFsExtendInflowStreakTo11Days #GoldFalls5.5%From3MonthHigh #HangSengFalls1%