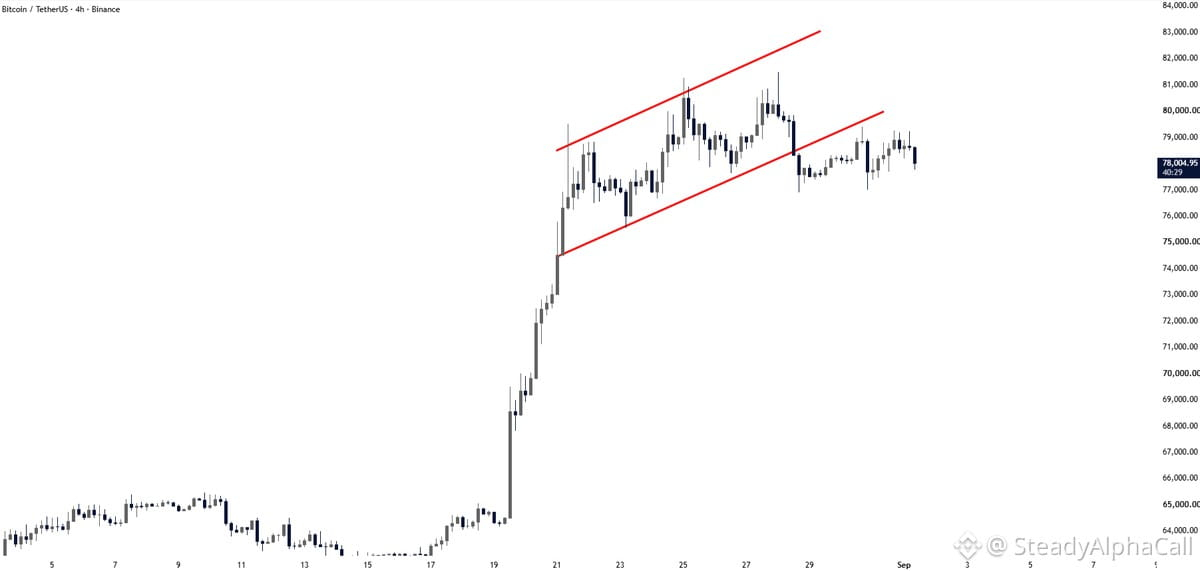
Someone's asking Grok to break down a $BTC chart in simple terms. Classic move when you want the basics without the noise.
Here's how I'd read it: $BTC moves in cycles. Right now, we're either consolidating after a run or setting up for the next leg. If you're holding long-term, this is just noise. Zoom out.
What matters: Is the macro backdrop still supportive? Are we still in a bull cycle? If yes, then dips are for adding, not panicking. If the chart shows support holding and higher lows forming, that's your signal to stay patient.
Don't get caught up in every swing. Time in the market beats timing the market. Hold your conviction, stick to your plan, and let the cycle play out.
Here's how I'd read it: $BTC moves in cycles. Right now, we're either consolidating after a run or setting up for the next leg. If you're holding long-term, this is just noise. Zoom out.
What matters: Is the macro backdrop still supportive? Are we still in a bull cycle? If yes, then dips are for adding, not panicking. If the chart shows support holding and higher lows forming, that's your signal to stay patient.
Don't get caught up in every swing. Time in the market beats timing the market. Hold your conviction, stick to your plan, and let the cycle play out.